T-Formation: The Ultimate Cyclical Power Tool?
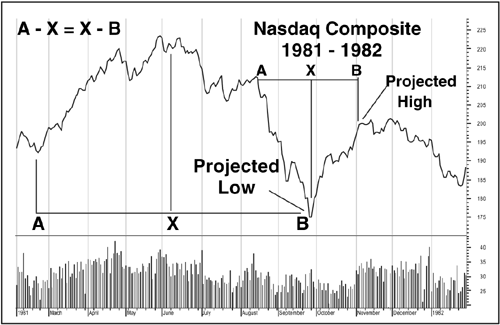
Chart 5.6. The Nasdaq Composite Index and T-Formations (November 1981–May 1982)
Chart 5.6 provides examples of T-formation measurements that might have been made between 1981 and 1982. As you can see, these formations provided some excellent projections of market tops and lows prior to their completion.

The T-formation is one of my favorite technical power tools. This tool is applicable to both long- and short-term trading operations, although it usually requires minimum time for construction and calculation. T-formations appear applicable to a wide variety of investment ...
Get Technical Analysis: Power Tools for Active Investors now with the O’Reilly learning platform.
O’Reilly members experience books, live events, courses curated by job role, and more from O’Reilly and nearly 200 top publishers.

