15.2. Manual Graphing of the Sine Wave
15.2.1. Plotting Point Pairs
We can graph any curve, including the sine wave, by computing and plotting point pairs, as we did for other functions.
Example 7:Given the sine function
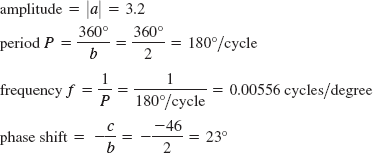
find the amplitude, period, frequency, and phase shift. Make a graph of at least one cycle by computing and plotting point pairs. Solution: The constants in the equation are
Therefore,
Let us compute points from x = − 15° to 195°, in steps of 15°.
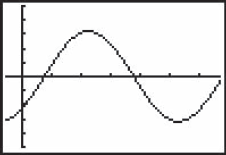
These points are plotted in Fig. 15-8 and connected with a smooth curve. For comparison, we show a calculator screen.
TI-83/84 calculator check for Example 7 y = 3.2 sin(2x − 46°). Tick marks on the x axis are 30° apart. Figure 15.8. FIGURE 15-8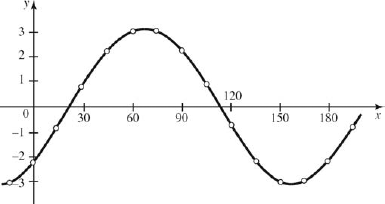
|
15.2.2. Quick Manual Graph of the Sine Wave
As shown in the preceding example, we can plot any curve by computing and plotting a set of point pairs. But a faster way to get a sketch is to first draw a rectangle whose height is twice the amplitude a and whose width equals the period P. Then sketch the sine curve (whose shape does ...
Get Technical Mathematics, Sixth Edition now with the O’Reilly learning platform.
O’Reilly members experience books, live events, courses curated by job role, and more from O’Reilly and nearly 200 top publishers.

