Chapter 2 Course Metrics Dashboard
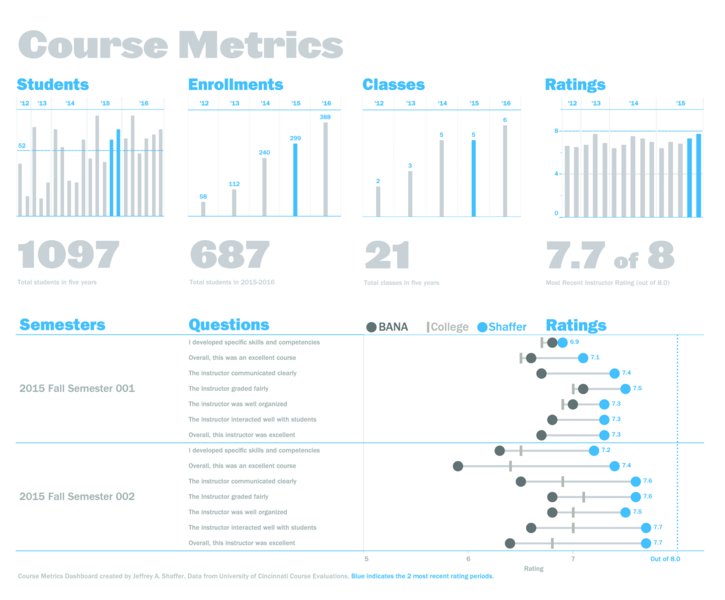
Course metrics dashboard.
Dashboard Designer: Jeffrey A. Shaffer
Organization: University of Cincinnati
Scenario
Big Picture
You are a professor at a university or the head of an academic department. You want to know how a particular professor's course is rated compared to others in the department and the college. You want to know the overall course load, the number of students, and the overall growth or decline of a particular course. You also want to be able to see the rating comparing one specific course against all of the courses in the department and in the college.
Specifics
- You need to see how many courses an instructor has been teaching over time.
- You need to see how many students are registering for the classes.
- You want to see the trend over a specific period of time. This might be the entire span of the course (as shown in the overview dashboard), or it may be a rolling period of time, for example, the last five years.
- You would like to see the detailed ratings of the most recent course and instructor feedback.
- You need to be able to quickly compare this course and instructor to other courses in the department and the college.
Related Scenarios
- You conduct workshops or seminars and need to see ratings for these offerings.
- You conduct training programs at your company on various topics and need to track sign-ups and feedback ...
Get The Big Book of Dashboards now with the O’Reilly learning platform.
O’Reilly members experience books, live events, courses curated by job role, and more from O’Reilly and nearly 200 top publishers.

