Chapter 1. Introduction

image with no caption

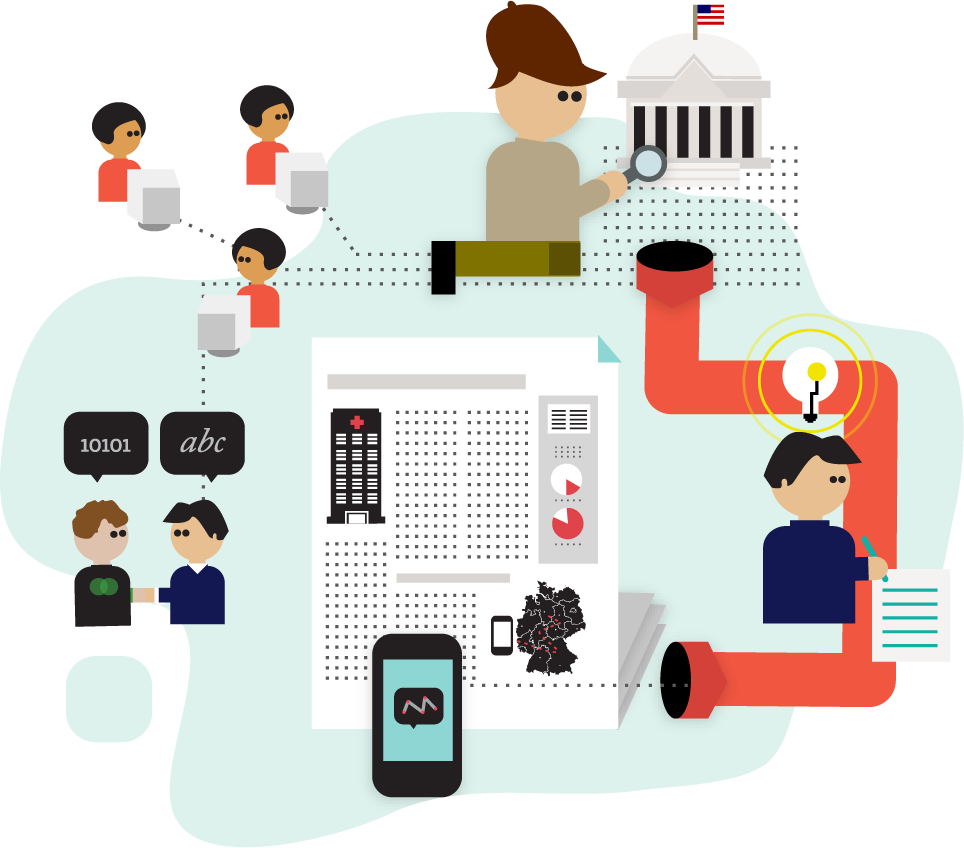
What is data journalism? What potential does it have? What are its limits? Where does it come from? In this section we look at what data journalism is and what it might mean for news organizations. Paul Bradshaw (Birmingham City University) and Mirko Lorenz (Deutsche Welle) say a bit about what is distinctive about data journalism. Leading data journalists tell us why they think it is important and what their favorite examples are. Finally Liliana Bounegru (European Journalism Centre) puts data journalism into its broader historical context.

What Is Data Journalism?

What is data journalism? I could answer, simply, that it is journalism done with data. But that doesn’t help much.

Both “data” and “journalism” are troublesome terms. Some people think of “data” as any collection of numbers, most likely gathered on a spreadsheet. 20 years ago, that was pretty much the only sort of data that journalists dealt with. But we live in a digital world now, a world in which almost anything can be (and almost everything is) described with numbers.

Your career history, 300,000 confidential documents, everyone in your circle of friends; these can all be (and are) described with just two numbers: zeroes, and ones. Photos, video, and audio are all described with the same two numbers: zeroes and ones. Murders, disease, political votes, corruption, and lies: zeroes and ones.

What makes data journalism different to the rest of journalism? Perhaps it is the new possibilities that open up when you combine the traditional “nose for news” and ability to tell a compelling story with the sheer scale and range of digital information now available.

And those possibilities can come at any stage of the journalist’s process: using programming to automate the process of gathering and combining information from local government, police, and other civic sources, as Adrian Holovaty did with ChicagoCrime and then EveryBlock.

Or using software to find connections between hundreds of thousands of documents, as The Telegraph did with MPs’ expenses (http://tgr.ph/mps-expenses).

Investigate your MP’s expenses (the Guardian)

Figure 1-1. Investigate your MP’s expenses (the Guardian)

Data journalism can help a journalist tell a complex story through engaging infographics. For example, Hans Rosling’s spectacular talks on visualizing world poverty with Gapminder have attracted millions of views across the world. And David McCandless’ popular work in distilling big numbers—such as putting public spending into context, or the pollution generated and prevented by the Icelandic volcano—shows the importance of clear design at Information is Beautiful.

Or it can help explain how a story relates to an individual, as the BBC and the Financial Times now routinely do with their budget interactives (where you can find out how the budget affects you, rather than “Joe Public”). And it can open up the news-gathering process itself, as the Guardian does so successfully in sharing data, context, and questions with their Datablog.

Data can be the source of data journalism, or it can be the tool with which the story is told—or it can be both. Like any source, it should be treated with skepticism; and like any tool, we should be conscious of how it can shape and restrict the stories that are created with it.

Paul Bradshaw, Birmingham City University

Why Journalists Should Use Data

Journalism is under siege. In the past we, as an industry, relied on being the only ones operating a technology to multiply and distribute what had happened overnight. The printing press served as a gateway. If anybody wanted to reach the people of a city or region the next morning, they would turn to newspapers. This era is over.

Today, news stories are flowing in as they happen, from multiple sources, eyewitnesses, and blogs, and what has happened is filtered through a vast network of social connections, being ranked, commented on—and more often than not, ignored.

This is why data journalism is so important. Gathering, filtering, and visualizing what is happening beyond what the eye can see has a growing value. The orange juice you drink in the morning, the coffee you brew: in today’s global economy, there are invisible connections between these products, other people, and you. The language of this network is data: little points of information that are often not relevant in a single instance, but massively important when viewed from the right angle.

Right now, a few pioneering journalists already demonstrate how data can be used to create deeper insights into what is happening around us and how it might affect us.

Data analysis can reveal “a story’s shape” (Sarah Cohen), or provides us with a “new camera” (David McCandless). By using data, the job of journalists shifts its main focus from being the first ones to report to being the ones telling us what a certain development might actually mean. The range of topics can be wide. The next financial crisis that is in the making. The economics behind the products we use. The misuse of funds or political blunders, presented in a compelling data visualization that leaves little room to argue with it.

This is why journalists should see data as an opportunity. They can, for example, reveal how some abstract threat (such as unemployment) affects people based on their age, gender, or education. Using data transforms something abstract into something everyone can understand and relate to.

They can create personalized calculators to help people to make decisions, be this buying a car, a house, deciding on an education or professional path in life, or doing a hard check on costs to stay out of debt.

They can analyze the dynamics of a complex situation like a riot or political debate, show fallacies, and help everyone to see possible solutions to complex problems.

Becoming knowledgeable in searching, cleaning, and visualizing data is transformative for the profession of information gathering, too. Journalists who master this will experience that building articles on facts and insights is a relief. Less guessing, less looking for quotes; instead, a journalist can build a strong position supported by data, and this can affect the role of journalism greatly.

Additionally, getting into data journalism offers a future perspective. Today, when newsrooms downsize, most journalists hope to switch to public relations. Data journalists or data scientists, though, are already a sought-after group of employees, not only in the media. Companies and institutions around the world are looking for “sensemakers” and professionals who know how to dig through data and transform it into something tangible.

There is a promise in data, and this is what excites newsrooms, making them look for a new type of reporter. For freelancers, proficiency with data provides a route to new offerings and stable pay, too. Look at it this way: instead of hiring journalists to quickly fill pages and websites with low value content, the use of data could create demand for interactive packages, where spending a week on solving one question is the only way to do it. This is a welcome change in many parts of the media.

There is one barrier keeping journalists from using this potential: training themselves to work with data through all the steps—from a first question to a big data-driven scoop.

Working with data is like stepping into vast, unknown territory. At first look, raw data is puzzling to the eyes and to the mind. Such data is unwieldy. It is quite hard to shape it correctly for visualization. It needs experienced journalists, who have the stamina to look at often confusing or boring raw data and “see” the hidden stories in there.

Mirko Lorenz, Deutsche Welle

European Journalism Centre survey on training needs

Figure 1-2. European Journalism Centre survey on training needs

Why Is Data Journalism Important?

We asked some of data journalism’s leading practitioners and proponents why they think data journalism is an important development. Here is what they said.

Filtering the Flow of Data

When information was scarce, most of our efforts were devoted to hunting and gathering. Now that information is abundant, processing is more important. We process at two levels: 1) analysis to bring sense and structure out of the never-ending flow of data and 2) presentation to get what’s important and relevant into the consumer’s head. Like science, data journalism discloses its methods and presents its findings in a way that can be verified by replication.

Philip Meyer, Professor Emeritus, University of North Carolina at Chapel Hill

New Approaches to Storytelling

Data journalism is an umbrella term that, to my mind, encompasses an ever-growing set of tools, techniques, and approaches to storytelling. It can include everything from traditional computer-assisted reporting (using data as a “source”) to the most cutting-edge data visualization and news applications. The unifying goal is a journalistic one: providing information and analysis to help inform us all about important issues of the day.

Aron Pilhofer, New York Times

Like Photo Journalism with a Laptop

“Data journalism” only differs from “words journalism” in that we use a different kit. We all sniff out, report, and relate stories for a living. It’s like “photo journalism”; just swap the camera for a laptop.

Brian Boyer, Chicago Tribune

Data Journalism Is the Future

Data-driven journalism is the future. Journalists need to be data-savvy. It used to be that you would get stories by chatting to people in bars, and it still might be that you’ll do it that way sometimes. But now it’s also going to be about poring over data and equipping yourself with the tools to analyze it and pick out what’s interesting. And keeping it in perspective, helping people out by really seeing where it all fits together, and what’s going on in the country.

Tim Berners-Lee, founder of the World Wide Web

Number-Crunching Meets Word-Smithing

Data journalism is bridging the gap between stat technicians and wordsmiths. Locating outliers and identifying trends that are not just statistically significant, but relevant to de-compiling the inherently complex world of today.

David Anderton, freelance journalist

Updating Your Skills Set

Data journalism is a new set of skills for searching, understanding, and visualizing digital sources in a time when basic skills from traditional journalism just aren’t enough. It’s not a replacement of traditional journalism, but an addition to it.

In a time when sources are going digital, journalists can and have to be closer to those sources. The Internet opened up possibilities beyond our current understanding. Data journalism is just the beginning of evolving our past practices to adapt to the online.

Data journalism serves two important purposes for news organizations: finding unique stories (not from news wires), and executing the watchdog function. Especially in times of financial peril, these are important goals for newspapers to achieve.

From the standpoint of a regional newspaper, data journalism is crucial. We have the saying “a loose tile in front of your door is considered more important than a riot in a far-away country.” It hits you in the face and impacts your life more directly. At the same time, digitization is everywhere. Because local newspapers have this direct impact in their neighborhood and sources become digitalized, a journalist must know how to find, analyze and visualize a story from data.

Jerry Vermanen, NU.nl

A Remedy for Information Asymmetry

Information asymmetry—not the lack of information, but the inability to take in and process it with the speed and volume that it comes to us—is one of the most significant problems that citizens face in making choices about how to live their lives. Information taken in from print, visual, and audio media influence citizens’ choices and actions. Good data journalism helps to combat information asymmetry.

Tom Fries, Bertelsmann Foundation

An Answer to Data-Driven PR

The availability of measurement tools and their decreasing prices—in a self-sustaining combination with a focus on performance and efficiency in all aspects of society—have led decision-makers to quantify the progresses of their policies, monitor trends, and identify opportunities.

Companies keep coming up with new metrics showing how well they perform. Politicians love to brag about reductions in unemployment numbers and increases in GDP. The lack of journalistic insight in the Enron, Worldcom, Madoff, or Solyndra affairs is proof of many a journalist’s inability to clearly see through numbers. Figures are more likely to be taken at face value than other facts, as they carry an aura of seriousness even when they are entirely fabricated.

Fluency with data will help journalists sharpen their critical sense when faced with numbers and will hopefully help them gain back some terrain in their exchanges with PR departments.

Nicolas Kayser-Bril, Journalism++

Providing Independent Interpretations of Official Information

After the devastating earthquake and subsequent Fukushima nuclear plant disaster in 2011, the importance of data journalism has been driven home to media people in Japan, a country which is generally lagging behind in digital journalism.

We were at a loss when the government and experts had no credible data about the damage. When officials hid SPEEDI data (predicted diffusion of radioactive materials) from the public, we were not prepared to decode it even if it were leaked. Volunteers began to collect radioactive data by using their own devices, but we were not armed with the knowledge of statistics, interpolation, visualization, and so on. Journalists need to have access to raw data, and to learn not to rely on official interpretations of it.

Isao Matsunami, Tokyo Shimbun

Dealing with the Data Deluge

The challenges and opportunities presented by the digital revolution continue to disrupt journalism. In an age of information abundance, journalists and citizens alike all need better tools, whether we’re curating the samizdat of the 21st century in the Middle East, processing a late night data dump, or looking for the best way to visualize water quality for a nation of consumers. As we grapple with the consumption challenges presented by this deluge of data, new publishing platforms are also empowering everyone to gather and share data digitally, turning it into information. While reporters and editors have been the traditional vectors for information gathering and dissemination, the flattened information environment of 2012 now has news breaking online first, not on the news desk.

Around the globe, in fact, the bond between data and journalism is growing stronger. In an age of big data, the growing importance of data journalism lies in the ability of its practitioners to provide context, clarity, and—perhaps most important—find truth in the expanding amount of digital content in the world. That doesn’t mean that the integrated media organizations of today don’t play a crucial role. Far from it. In the information age, journalists are needed more than ever to curate, verify, analyze, and synthesize the wash of data. In that context, data journalism has profound importance for society.

Today, making sense of big data, particularly unstructured data, will be a central goal for data scientists around the world, whether they work in newsrooms, Wall Street, or Silicon Valley. Notably, that goal will be substantially enabled by a growing set of common tools, whether they’re employed by government technologists opening Chicago, healthcare technologists, or newsroom developers.

Alex Howard, O’Reilly Media

Our Lives Are Data

Good data journalism is hard, because good journalism is hard. It means figuring out how to get the data, how to understand it, and how to find the story. Sometimes there are dead ends, and sometimes there’s no great story. After all, if it were just a matter of pressing the right button, it wouldn’t be journalism. But that’s what makes it worthwhile, and—in a world where our lives are increasingly data—essential for a free and fair society.

Chris Taggart, OpenCorporates

A Way to Save Time

Journalists don’t have time to waste transcribing things by hand and messing around trying to get data out of PDFs, so learning a little bit of code (or knowing where to look for people who can help) is incredibly valuable.

One reporter from Folha de São Paulo was working with the local budget and called me to thank us for putting up the accounts of the municipality of São Paolo online (two days work for a single hacker!). He said he had been transcribing them by hand for the past three months, trying to build up a story. I also remember solving a “PDF issue” for Contas Abertas, a parliamentary monitoring news organization: 15 minutes and 15 lines of code solved a month’s worth of work.

Pedro Markun, Transparência Hacker

An Essential Part of the Journalists’ Toolkit

I think it’s important to stress the “journalism” or reporting aspect of “data journalism.” The exercise should not be about just analyzing or visualizing data for the sake of it, but to use it as a tool to get closer to the truth of what is going on in the world. I see the ability to be able to analyze and interpret data as an essential part of today’s journalists’ toolkit, rather than a separate discipline. Ultimately, it is all about good reporting, and telling stories in the most appropriate way.

Data journalism is another way to scrutinize the world and hold the powers that be to account. With an increasing amount of data available, it is now more important than ever that journalists are aware of data journalism techniques. This should be a tool in the toolkit of any journalist, whether learning how to work with data directly, or collaborating with someone who can.

Its real power is in helping you to obtain information that would otherwise be very difficult to find or to prove. A good example of this is Steve Doig’s story that analyzed damage patterns from Hurricane Andrew. He joined two different datasets: one mapping the level of destruction caused by the hurricane, and one showing wind speeds. This allowed him to pinpoint areas where weakened building codes and poor construction practices contributed to the impact of the disaster. He won a Pulitzer Prize for the story in 1993 (http://www.pulitzer.org/awards/1993) and it’s still a great example of what is possible.

Ideally, you use the data to pinpoint outliers, areas of interest, or things that are surprising. In this sense, data can act as a lead or a tip off. While numbers can be interesting, just writing about the data is not enough. You still need to do the reporting to explain what it means.

Cynthia O’Murchu, Financial Times

Adapting to Changes in Our Information Environment

New digital technologies bring new ways of producing and disseminating knowledge in society. Data journalism can be understood as the media’s attempt to adapt and respond to the changes in our information environment, including more interactive, multidimensional storytelling enabling readers to explore the sources underlying the news and encouraging them to participate in the process of creating and evaluating stories.

César Viana, University of Goiás

A Way to See Things You Might Not Otherwise See

Some stories can only be understood and explained through analyzing—and sometimes visualizing—the data. Connections between powerful people or entities would go unrevealed, deaths caused by drug policies would remain hidden, environmental policies that hurt our landscape would continue unabated. But each of the above was changed because of data that journalists have obtained, analyzed, and provided to readers. The data can be as simple as a basic spreadsheet or a log of cell phone calls, or complex as school test scores or hospital infection data, but inside it all are stories worth telling.

Cheryl Phillips, The Seattle Times

A Way To Tell Richer Stories

We can paint pictures of our entire lives with our digital trails. From what we consume and browse, to where and when we travel, to our musical preferences, our first loves, our children’s milestones, even our last wishes – it all can be tracked, digitized, stored in the cloud, and disseminated. This universe of data can be surfaced to tell stories, answer questions and impart an understanding of life in ways that currently surpass even the most rigorous and careful reconstruction of anecdotes.

Sarah Slobin, Wall Street Journal

Some Favorite Examples

We asked some of our contributors for their favorite examples of data journalism and what they liked about them. Here they are.

Do No Harm in the Las Vegas Sun

My favorite example is the Las Vegas Sun’s 2010 Do No Harm series on hospital care (http://www.lasvegassun.com/hospital-care/). The Sun analyzed more than 2.9 million hospital billing records, which revealed more than 3,600 preventable injuries, infections and surgical mistakes. They obtained data through a public records request and identified more than 300 cases in which patients died because of mistakes that could have been prevented. It contains different elements, including an interactive graphic that allows the reader to see (by hospital) where surgical injuries happened more often than would be expected; a map with a timeline that shows infections spreading hospital by hospital; and an interactive graphic that allows users to sort data by preventable injuries or by hospital to see where people are getting hurt. I like it because it is very easy to understand and navigate. Users can explore the data in a very intuitive way.

It also had a real impact: the Nevada legislature responded with six pieces of legislation. The journalists involved worked very hard to acquire and clean up the data. One of the journalists, Alex Richards, sent data back to hospitals and to the state at least a dozen times to get mistakes corrected.

Angélica Peralta Ramos, La Nación (Argentina)

Do No Harm (The Las Vegas Sun)

Figure 1-3. Do No Harm (The Las Vegas Sun)

Government Employee Salary Database

I love the work that small independent organizations are performing every day, such as ProPublica or the Texas Tribune, who have a great data reporter in Ryan Murphy. If I had to choose, I’d pick the Government Employee Salary Database project from the Texas Tribune (http://bit.ly/texastrib-employee). This project collects 660,000 government employee salaries into a database for users to search and help generate stories from. You can search by agency, name, or salary. It’s simple, meaningful, and is making inaccessible information public. It is easy to use and automatically generates stories. It is a great example of why the Texas Tribune gets most of its traffic from the data pages.

Simon Rogers, the Guardian

Government Employee Salaries (The Texas Tribune)

Figure 1-4. Government Employee Salaries (The Texas Tribune)

Full-Text Visualization of the Iraqi War Logs, Associated Press

Jonathan Stray and Julian Burgess’ work on Iraq War Logs is an inspiring foray into text analysis and visualization using experimental techniques to gain insight into themes worth exploring further within a large textual dataset.

By means of text-analytics techniques and algorithms, Jonathan and Julian created a method that showed clusters of keywords contained in thousands of US-government reports on the Iraq war leaked by WikiLeaks, in a visual format.

Though there are limitations to this method and the work is experimental, it is a fresh and innovative approach. Rather than trying to read all the files or reviewing the War Logs with a preconceived notion of what may be found by inputting particular keywords and reviewing the output, this technique calculates and visualizes topics/keywords of particular relevance.

With increasing amounts of textual (emails, reports, etc.) and numeric data coming into the public domain, finding ways to pinpoint key areas of interest will become more and more important. It is an exciting subfield of data journalism.

Cynthia O’Murchu, Financial Times

Analyzing the war logs (Associated Press)

Figure 1-5. Analyzing the war logs (Associated Press)

Murder Mysteries

One of my favorite pieces of data journalism is the Murder Mysteries project by Tom Hargrove of the Scripps Howard News Service (http://bit.ly/murder-mysteries). From government data and public records requests, he built a demographically detailed database of more than 185,000 unsolved murders, and then designed an algorithm to search it for patterns suggesting the possible presence of serial killers. This project has it all: hard work, a database better than the government’s own, clever analysis using social science techniques, and interactive presentation of the data online so readers can explore it themselves.

Steve Doig, Walter Cronkite School of Journalism, Arizona State University

Murder Mysteries (Scripps Howard News Service)

Figure 1-6. Murder Mysteries (Scripps Howard News Service)

Message Machine

I love ProPublica’s Message Machine story and nerd blog post (http://bit.ly/nerd-blog-post). It all got started when some Twitterers expressed curiosity about having received different emails from the Obama campaign. The folks at ProPublica noticed, and asked their audience to forward any emails they got from the campaign. The presentation is elegant, a visual diff of several different emails that were sent out that evening. It’s awesome because they gathered their own data (admittedly a small sample, but big enough to tell the story). But it’s even more awesome because they’re telling the story of an emerging phenomenon: big data used in political campaigns to target messages to specific individuals. It is just a taste of things to come.

Brian Boyer, Chicago Tribune

Message Machine (ProPublica)

Figure 1-7. Message Machine (ProPublica)

Chartball

One of my favorite data journalism projects is Andrew Garcia Phillips’ work on Chartball (http://www.chartball.com/). Andrew is a huge sports fan with a voracious appetite for data, a terrific eye for design, and the capacity to write code. With Chartball he visualizes not only the sweep of history, but details the success and failures of individual players and teams. He makes context, he makes an inviting graphic, and his work is deep and fun and interesting—and I don’t even care much for sports!

Sarah Slobin, Wall Street Journal

Charting victory and defeat (Chartball)

Figure 1-8. Charting victory and defeat (Chartball)

Data Journalism in Perspective

In August 2010 some colleagues at the European Journalism Centre and I organized what we believe was one of the first international data journalism conferences, which took place in Amsterdam. At this time there wasn’t a great deal of discussion around this topic and there were only a couple of organizations that were widely known for their work in this area.

The manner in which media organizations like the Guardian and The New York Times handled the large amounts of data released by WikiLeaks is one of the major steps that brought the term into prominence. Around that time, the term started to enter into more widespread usage (along with “computer-assisted reporting”) to describe how journalists were using data to improve their coverage and to augment in-depth investigations into a given topic.

Speaking to experienced data journalists and journalism scholars on Twitter it seems that one of the earliest formulations of what we now recognize as data journalism was in 2006 by Adrian Holovaty, founder of EveryBlock, an information service that enables users to find out what has been happening in their area, on their block. In his short essay “A fundamental way newspaper sites need to change”, he argues that journalists should publish structured, machine-readable data, alongside the traditional “big blob of text”:

For example, say a newspaper has written a story about a local fire. Being able to read that story on a cell phone is fine and dandy. Hooray, technology! But what I really want to be able to do is explore the raw facts of that story, one by one, with layers of attribution, and an infrastructure for comparing the details of the fire with the details of previous fires: date, time, place, victims, fire station number, distance from fire department, names and years experience of firemen on the scene, time it took for firemen to arrive, and subsequent fires, whenever they happen.

But what makes this distinctive from other forms of journalism that use databases or computers? How, and to what extent is data journalism different from other forms of journalism from the past?

Computer-Assisted Reporting and Precision Journalism

Using data to improve reportage and delivering structured (if not machine-readable) information to the public has a long history. Perhaps most immediately relevant to what we now call data journalism is computer-assisted reporting, or CAR, which was the first organized, systematic approach to using computers to collect and analyze data to improve the news.

CAR was first used in 1952 by CBS to predict the result of the presidential election. Since the 1960s, (mainly investigative, mainly US-based) journalists have sought to independently monitor power by analyzing databases of public records with scientific methods. Also known as “public service journalism,” advocates of these computer-assisted techniques have sought to reveal trends, debunk popular knowledge and reveal injustices perpetrated by public authorities and private corporations. For example, Philip Meyer tried to debunk received readings of the 1967 riots in Detroit to show that it was not just less educated Southerners who were participating. Bill Dedman’s “The Color of Money” stories in the 1980s revealed systemic racial bias in lending policies of major financial institutions. In his “What Went Wrong” article, Steve Doig sought to analyze the damage patterns from Hurricane Andrew in the early 1990s, to understand the effect of flawed urban development policies and practices. Data-driven reporting has brought valuable public service, and has won journalists famous prizes.

In the early 1970s the term precision journalism was coined to describe this type of news-gathering: “the application of social and behavioral science research methods to the practice of journalism” (from The New Precision Journalism by Philip Meyer; http://bit.ly/precision-journalism). Precision journalism was envisioned to be practiced in mainstream media institutions by professionals trained in journalism and social sciences. It was born in response to “new journalism,” a form of journalism in which fiction techniques were applied to reporting. Meyer suggests that scientific techniques of data collection and analysis, rather than literary techniques, are what is needed for journalism to accomplish its search for objectivity and truth.

Precision journalism can be understood as a reaction to some of journalism’s commonly cited inadequacies and weaknesses: dependence on press releases (later described as “churnalism”), bias towards authoritative sources, and so on. These are seen by Meyer as stemming from a lack of application of information science techniques and scientific methods such as polls and public records. As practiced in the 1960s, precision journalism was used to represent marginal groups and their stories. According to Meyer:

Precision journalism was a way to expand the tool kit of the reporter to make topics that were previously inaccessible, or only crudely accessible, subject to journalistic scrutiny. It was especially useful in giving a hearing to minority and dissident groups that were struggling for representation.

An influential article published in the 1980s about the relationship between journalism and social science echoes current discourse around data journalism. The authors, two US journalism professors, suggest that in the 1970s and 1980s, the public’s understanding of what news is broadens from a narrower conception of “news events” to “situational reporting” (or reporting on social trends). For example, by using databases of census data or survey data, journalists are able to “move beyond the reporting of specific, isolated events to providing a context which gives them meaning.”

As we might expect, the practice of using data to improve reportage goes back as far as data has been around. As Simon Rogers points out, the first example of data journalism at the Guardian dates from 1821. It is a leaked table of schools in Manchester listing the number of students who attended and the costs per school. According to Rogers, this helped to show the real number of students receiving free education, which was much higher than official numbers showed.

Data journalism in the Guardian in 1821 (the Guardian)

Figure 1-9. Data journalism in the Guardian in 1821 (the Guardian)

Another early example in Europe is Florence Nightingale and her key report, “Mortality of the British Army”, published in 1858. In her report to Parliament, she used graphics to advocate improvements in health services for the British army. The most famous is her “coxcomb,” a spiral of sections each representing deaths per month, which highlighted that the vast majority of deaths were from preventable diseases rather than bullets.

Mortality of the British army by Florence Nightingale (image from Wikipedia)

Figure 1-10. Mortality of the British army by Florence Nightingale (image from Wikipedia)

Data Journalism and Computer-Assisted Reporting

At the moment there is a “continuity and change” debate going on around the label “data journalism” and its relationship with previous journalistic practices that employ computational techniques to analyze datasets.

Some argue that there is a difference between CAR and data journalism. They say that CAR is a technique for gathering and analyzing data as a way of enhancing (usually investigative) reportage, whereas data journalism pays attention to the way that data sits within the whole journalistic workflow. In this sense data journalism pays as much—and sometimes more—attention to the data itself, rather than using data simply as a means to find or enhance stories. Hence we find the Guardian Datablog or the Texas Tribune publishing datasets alongside stories—or even just datasets by themselves—for people to analyze and explore.

Another difference is that in the past, investigative reporters would suffer from a poverty of information relating to a question they were trying to answer or an issue that they were trying to address. While this is of course still the case, there is also an overwhelming abundance of information that journalists don’t necessarily know what to do with. They don’t know how to get value out of data. A recent example is the Combined Online Information System, the UK’s biggest database of spending information. The database was long sought after by transparency advocates, but baffled and stumped many journalists upon its release. As Philip Meyer recently wrote to me: “When information was scarce, most of our efforts were devoted to hunting and gathering. Now that information is abundant, processing is more important.”

On the other hand, some argue that there is no meaningful difference between data journalism and computer-assisted reporting. It is by now common sense that even the most recent media practices have histories, as well as something new in them. Rather than debating whether or not data journalism is completely novel, a more fruitful position would be to consider it as part of a longer tradition, but responding to new circumstances and conditions. Even if there might not be a difference in goals and techniques, the emergence of the label “data journalism” at the beginning of the century indicates a new phase wherein the sheer volume of data that is freely available online—combined with sophisticated user-centric tools, self-publishing, and crowdsourcing tools—enables more people to work with more data more easily than ever before.

Data Journalism Is About Mass Data Literacy

Digital technologies and the web are fundamentally changing the way information is published. Data journalism is one part in the ecosystem of tools and practices that have sprung up around data sites and services. Quoting and sharing source materials is in the nature of the hyperlink structure of the Web, and the way we are accustomed to navigating information today. Going further back, the principle that sits at the foundation of the hyperlinked structure of the Web is the citation principle used in academic works. Quoting and sharing the source materials and the data behind the story is one of the basic ways in which data journalism can improve journalism, what WikiLeaks founder Julian Assange calls “scientific journalism.”

By enabling anyone to drill down into data sources and find information that is relevant to them, as well as to to verify assertions and challenge commonly received assumptions, data journalism effectively represents the mass democratization of resources, tools, techniques, and methodologies that were previously used by specialists; whether investigative reporters, social scientists, statisticians, analysts, or other experts. While currently quoting and linking to data sources is particular to data journalism, we are moving towards a world in which data is seamlessly integrated into the fabric of media. Data journalists have an important role in helping to lower the barriers to understanding and delving into data, and increasing the data literacy of their readers on a mass scale.

At the moment the nascent community of people who call themselves data journalists is largely distinct from the more mature CAR community. Hopefully in the future, we will see stronger ties between these two communities, in much the same way that we see new NGOs and citizen media organizations like ProPublica and the Bureau of Investigative Journalism work hand in hand with traditional news media on investigations. While the data journalism community might have more innovative ways to deliver data and present stories, the deeply analytical and critical approach of the CAR community is something that data journalism could certainly learn from.

Liliana Bounegru, European Journalism Centre

Get The Data Journalism Handbook now with the O’Reilly learning platform.

O’Reilly members experience books, live events, courses curated by job role, and more from O’Reilly and nearly 200 top publishers.