Comparisons
Suppose you were given two sets of figures for take-home pay shown on the left in Fig. 5.8. How would you analyse them? These are the figures which are illustrated on pp. 62 and 63 – which should give you your first clue. You could easily use your spreadsheet to create revealing charts.
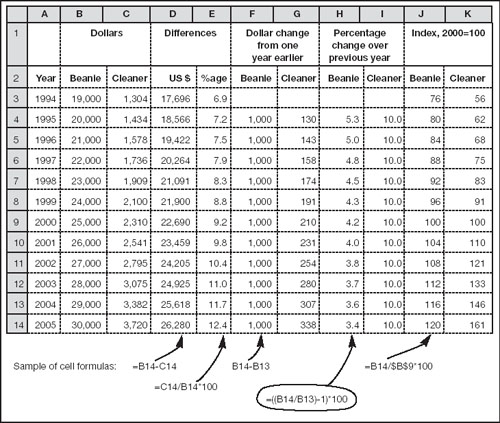
Another handy trick is to use a spreadsheet for some simple analysis. Columns D and E show the simplest comparison (e.g. that in 2000 the accountant’s pay was more than $22,000 greater than that of the cleaner – or, looking at it from the other angle, the cleaner’s pay was less than 10% that of the beanie’s). ...
Get The Definitive Guide to Business Finance: What smart managers do with the numbers, Second Edition now with the O’Reilly learning platform.
O’Reilly members experience books, live events, courses curated by job role, and more from O’Reilly and nearly 200 top publishers.

