OVER AND OUT
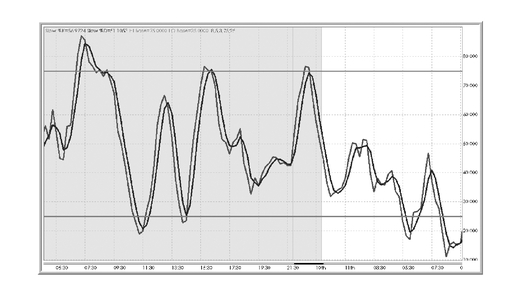
Notice the horizontal lines within the stochastic oscillator. The bottom line is placed at the 25 percent level. The bottom line is placed at the 75 percent level. Anytime the two lines are below the 25 percent level, price is considered oversold. Anytime the two lines are above the 75 percent level, price is considered overbought.
FIGURE 13.2 Stochastic Crosses
Source: DealBook® 360 screen capture printed by permission. © 2008 by Global Forex Trading, Ada MI USA

Does this mean sell above 75 percent or buy below 25 percent? Absolutely not! If there is a strong trend in place, price will cross these levels. Of course the market is oversold in a down trend—everyone is selling, and of course the market is overbought in an uptrend—everyone is buying!
There are two things to consider:
1. There must be no trend in place. The market must be in a range.
2. It’s when the two lines cross and return to the midrange between 25 percent and 75 percent that you want to take notice.
What you are looking for is a change in direction. You are expecting the direction change in price to occur at support and resistance. Your trade plan is to wait for price to challenge support and resistance, then look for an alert to pull the trigger.
As the currency pair bounces between these price levels, you will notice stochastics bouncing between the 25 percent and 75 percent lines. If ...
Get The FX Bootcamp Guide to Strategic and Tactical Forex Trading now with the O’Reilly learning platform.
O’Reilly members experience books, live events, courses curated by job role, and more from O’Reilly and nearly 200 top publishers.

