Model checking
After fitting a model to data we need to investigate how well the model describes the data. In particular, we should look to see if there are any systematic trends in the goodness of fit. For example, does the goodness of fit increase with the observation number, or is it a function of one or more of the explanatory variables? We can work with the raw residuals:

For instance, we should routinely plot the residuals against:
- the fitted values (to look for heteroscedasticity);
- the explanatory variables (to look for evidence of curvature);
- the sequence of data collection (to took for temporal correlation);
- standard normal deviates (to look for non-normality of errors).
Heteroscedasticity
A good model must also account for the variance–mean relationship adequately and produce additive effects on the appropriate scale (as defined by the link function). A plot of standardized residuals against fitted values should look like the sky at night (points scattered at random over the whole plotting region), with no trend in the size or degree of scatter of the residuals. A common problem is that the variance increases with the mean, so that we obtain an expanding, fan-shaped pattern of residuals (right-hand panel).
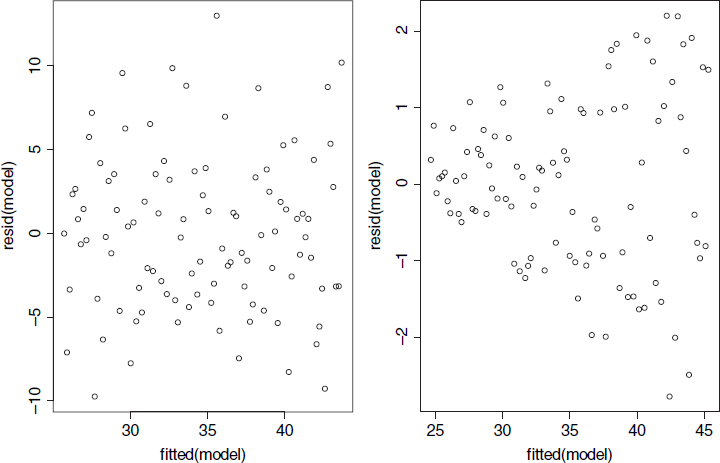
The plot on the left is what we want to see: no trend in the residuals ...
Get The R Book now with the O’Reilly learning platform.
O’Reilly members experience books, live events, courses curated by job role, and more from O’Reilly and nearly 200 top publishers.