ANCOVA with a Binary Response Variable
In our next example the binary response variable is parasite infection (infected or not) and the explanatory variables are weight and age (continuous) and sex (categorical). We begin with data inspection:
infection<-read.table("c:\\temp\\infection.txt,header=T)
attach(infection)
names(infection)

[1]  "infected"  "age"  "weight"  "sex"

par(mfrow=c(1,2))
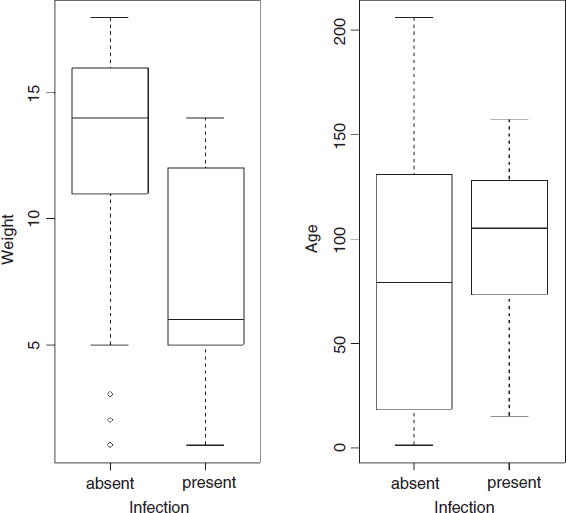
plot(infected,weight,xlab="Infection",ylab="Weight")
plot(infected,age,xlab="Infection",ylab="Age")

Infected individuals are substantially lighter than uninfected individuals, and occur in a much narrower range of ages. To see the relationship between infection and gender (both categori cal variables) we can use table:
table(infected,sex)

table(infected,sex)
            sex
infected    female    male
  absent        17      47
 present        11       6
This indicates that the infection is much more prevalent in females (11/28) than in males (6/53).
We now proceed, as usual, to fit a maximal model with different slopes for each level of the categorical variable:
model<-glm(infected~age*weight*sex,family=binomial)
summary(model) Coefficients: Estimate Std.Error z value Pr(>|z|) (Intercept) -0.109124 1.375388 -0.079 0.937 age 0.024128 0.020874 1.156 0.248 weight -0.074156 0.147678 -0.502 0.616 sexmale -5.969109 4.278066 -1.395 0.163 age:weight -0.001977 0.002006 -0.985 0.325 age:sexmale 0.038086 0.041325 0.922 0.357 weight:sexmale 0.213830 ...
Get The R Book now with the O’Reilly learning platform.
O’Reilly members experience books, live events, courses curated by job role, and more from O’Reilly and nearly 200 top publishers.

