Error Plots from a Hierarchical Analysis
You will find the syntax of model checking in lme both complicated and difficult to remember.
library(nlme)
library(lattice)
trellis.par.set(col.whitebg())
If you use the standard plot(model) with lme you get a single panel showing the standardized residuals as a function of the fitted values. For more comprehensive model checking, it is useful to make the dataframe into a groupedData object, then refit the model. Here we investigate the REML model with gender as a fixed effect:
hs<-groupedData(subject~gender|town/district/street/family/gender/replicate,
                                       outer=~gender,data=hierarchy)
model<-
lme(subject~gender,random=~1|town/district/street/family/gender,data=hs)
plot(model,gender~resid(.))
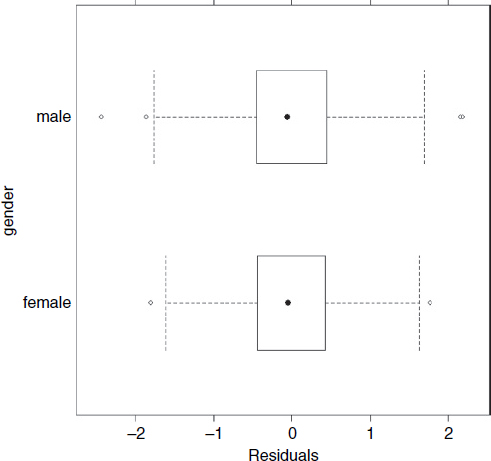
To inspect the constancy of variance across towns and check for heteroscedasticity:
plot(model,resid(.,type="p")~fitted(.)|town)
It should be clear that this kind of plot only makes sense for those variables with informative factor levels such as gender and town; it would make no sense to group together the streets labelled s1 or s3 or the families labelled f1, f2 or f3.
Tests for normality use the familiar QQ plots, but applied to panels:
qqnorm(model,~resid(.)|gender)
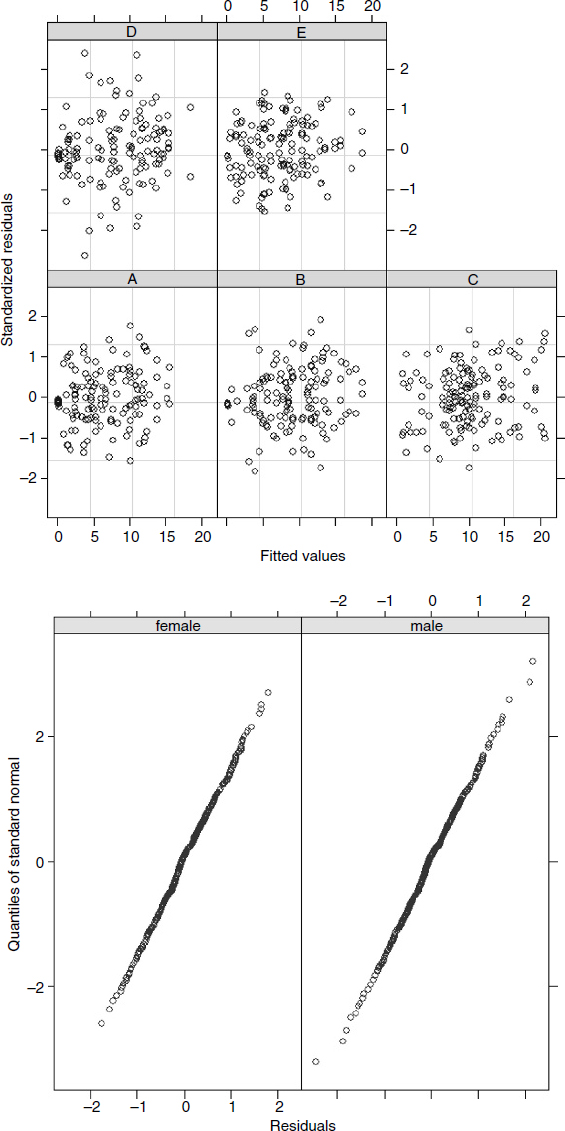
The residuals are normally distributed for both genders, and within each town: ...
Get The R Book now with the O’Reilly learning platform.
O’Reilly members experience books, live events, courses curated by job role, and more from O’Reilly and nearly 200 top publishers.