CHAPTER 8
Technical Analysis
Basic Momentum Indicators
In the prior chapter you saw how to use the basic tools that we've taught thus far. If you'd like to practice applying them, visit thesensibleguidetoforex.com, and search for the trade simulations exercises or trade diaries. That's where we'll post trade scenarios, give you the chance to play them, then provide suggested solutions.
Now it's time to add a new and different set of technical tools to your arsenal—momentum indicators. They are useful in helping to answer the following common trader dilemmas.
- What do you do if a currency pair (or any asset) is making historic highs or lows, so there isn't enough, or any, support or resistance to guide you in making entry and exit decisions?
- How do you know you're not buying at the top, or selling short at the bottom, just before the trend ends? Ideally in either case you'd wait for a pullback of some kind, but meanwhile you risk missing out on the trend!
- If you're in a winning trade and it approaches your planned exit, how do you know if you should take your planned exit, or leave at least some of the position in hopes of letting profits run with a trailing stop?
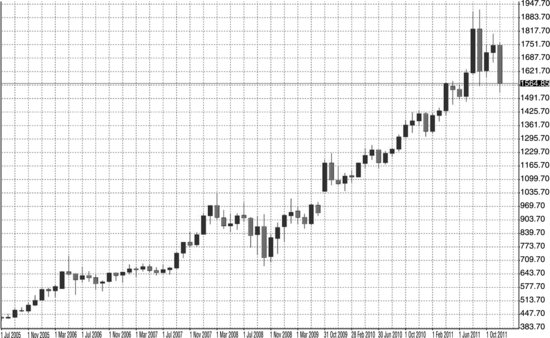
For example, look what happened to gold from May 2009 to August 2011 (see Figure 8.1).
From May 2009 to August 2011 it kept ...
Get The Sensible Guide to Forex: Safer, Smarter Ways to Survive and Prosper from the Start now with the O’Reilly learning platform.
O’Reilly members experience books, live events, courses curated by job role, and more from O’Reilly and nearly 200 top publishers.


