9How Aging Laws Influence Parametric and Catastrophic Reliability Distributions
9.1 Physics of Failure Influence on Reliability Distributions
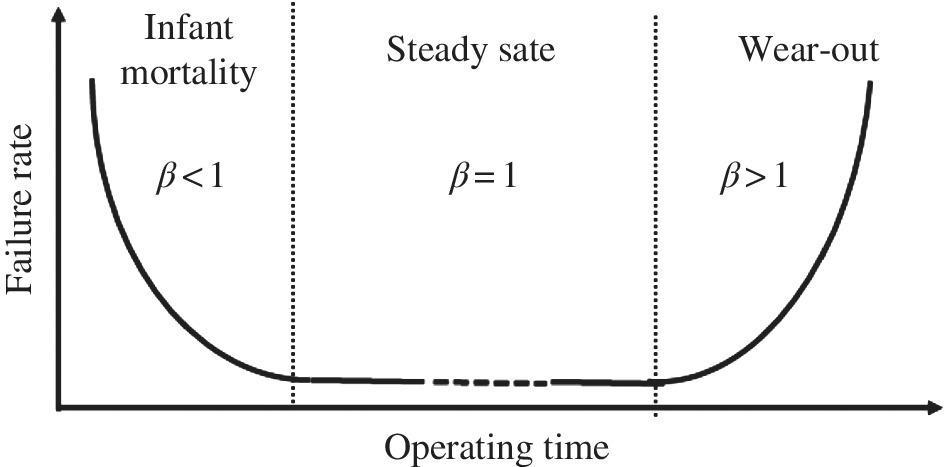
Reliability distributions are actually designed to fit regions of the bathtub curve shown in Figure 9.1. An overview of key reliability statistics is provided in Special Topics A to aid the reader.

Figure 9.1 Reliability bathtub curve model
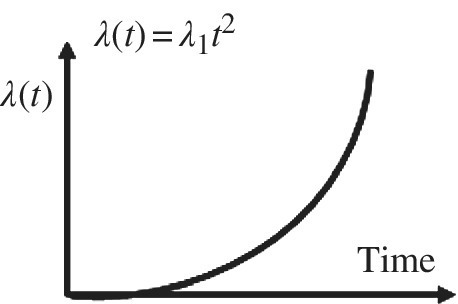
For example, the Weibull distribution is basically a power law over time (see Special Topics A.4.2). If we were to invent a distribution based on wear-out for example, we might use a failure rate λ(t) proportional to time raised to a power >1. For example, wear-out on a particular device may fit a power law with time squared as (Figure 9.2)

Figure 9.2 Power law fit to the wear-out portion of the bathtub curve
This is essentially a Weibull failure rate, although the actual Weibull failure rate is written in a more sophisticated way as (see Special Topics A.4.2):
This is still a power law and, in this case, β would equate to 3. Note α is the characteristic life. Many reliability engineers ...
Get Thermodynamic Degradation Science now with the O’Reilly learning platform.
O’Reilly members experience books, live events, courses curated by job role, and more from O’Reilly and nearly 200 top publishers.

