Chapter 5. Autocorrelation
In the previous chapter I characterized white noise as “uncorrelated”, which means that each value is independent of the others, and Brownian noise as “correlated”, because each value depends on the preceding value. In this chapter I define these terms more precisely and present the autocorrelation function, which is a useful tool for signal analysis.
The code for this chapter is in chap05.ipynb, which is in the repository for this book (see “Using the Code”). You can also view it at http://tinyurl.com/thinkdsp05.
Correlation
In general, correlation between variables means that if you know the value of one, you have some information about the other. There are several ways to quantify correlation, but the most common is the Pearson product-moment correlation coefficient, usually denoted ρ. For two variables, x and y, that each contain N values:
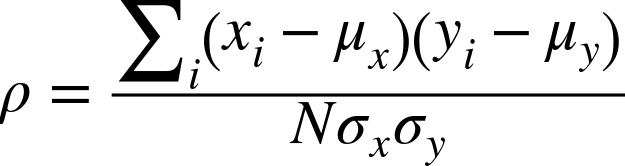
where μx and μy are the means of x and y, and σx and σy are their standard deviations.
Pearson’s correlation is always between –1 and +1 (including both). If ρ is positive, we say that the correlation is positive, which means that when one variable is high, the other tends to be high. If ρ is negative, the correlation is negative, so when one variable is high, the other tends to be low.
The magnitude of ρ indicates the strength of the correlation. If ρ is 1 or –1, the variables are perfectly correlated, which means that ...
Get Think DSP now with the O’Reilly learning platform.
O’Reilly members experience books, live events, courses curated by job role, and more from O’Reilly and nearly 200 top publishers.

