Collection of Tables and Charts
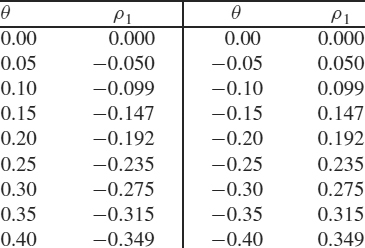
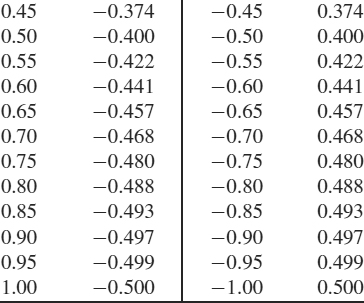
| Table A | Table relating ρ1 to θ for a first-order moving average process |
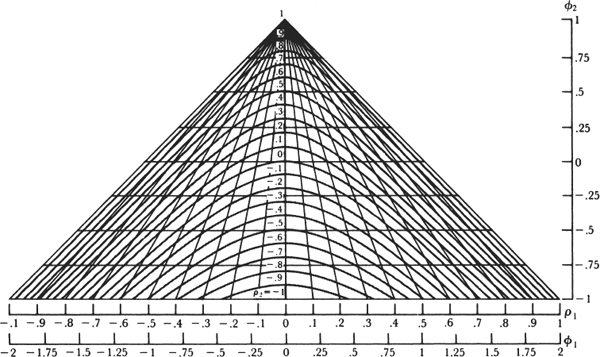
| Chart B | Chart relating ρ1 and ρ2 to ϕ1 and ϕ2 for a second-order autoregressive process |
| Chart C | Chart relating ρ1 and ρ2 to θ1 and θ2 for a second-order moving average process |
| Chart D | Chart relating ρ1 and ρ2 to ϕ and θ for a mixed first-order autoregressive–moving average process |
| Table E | Tail areas and ordinates of unit normal distribution |
| Table F | Tail areas of the chi-square distribution |
| Table G | Tail areas of the t distribution |
Charts B, C, and D are adapted and reproduced by permission of the author from [270]. Tables E, F, and G are condensed and adapted from Biometrika Tables for Statisticians, Volume I, with permission from the trustees of Biometrika.
Table A Table Relating ρ1 to θ for a First-Order Moving Average Process


Table A may be used to obtain first estimates of the parameters in the (0, d, 1) model wt = (1 − θB)at, where wt = ∇dzt, by substituting r1(w) for ρ1.

CHART B Chart relating ρ1 and ρ2 to ϕ1 and ϕ2 for a second-order autoregressive process.
The chart may be used to obtain estimates of the parameters in the (2, d, 0) model (1 − ϕ1B − ϕ2B
Get Time Series Analysis: Forecasting and Control, Fourth Edition now with the O’Reilly learning platform.
O’Reilly members experience books, live events, courses curated by job role, and more from O’Reilly and nearly 200 top publishers.

