Chapter 17
Horizontal Lines: Swing Points and Other Key Price Levels
Most days are trading range days or have a lot of trading range activity. On these days you will find that horizontal lines across swing highs and lows often serve as barriers that result in failed breakouts and then reversals. Expect swing high breakouts to fail and form higher high reversal setups, and swing low breakouts to fail and form lower low reversal setups. Sometimes the failure fails, which is a breakout pullback setup, and the market makes a second more extreme higher high or lower low. A fade of a second higher high or lower low setup is even more likely to be successful, because they are second attempts to reverse the market and second signals are good setups on trading range days.
On trend days, horizontal lines should generally be used only to enter on pullbacks. For example, if there is a strong upside breakout of a trading range on a bull trend day, there might be a pullback to the area of breakout level after a few bars. If there is a bull reversal setup on the test, this is a good breakout pullback buy setup.
Figure 17.1 Breakouts Can Set Up Reversals
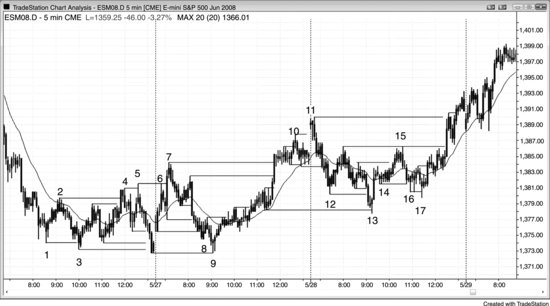
Most days are not strong trend days, and on these days traders should be looking at all prior swing highs and lows to see if the market creates failed breakouts, which can lead to reversal entries. Second signals are the best. A second higher ...

