April 2024
Beginner
5 pages
6m
English
You’re working on building a new visualization that depicts your organization’s sales per month for the past few years. This visualization has a small section cut out for it on your KPI dashboard, and your hope is to get it to fit in this assigned space. You drag your date field in as a discrete month/year, and then you bring in the sales measure. You work on the chart a bit more and end up with a nice looking bar chart. You then add the chart to your dashboard. The end result is something like the following.
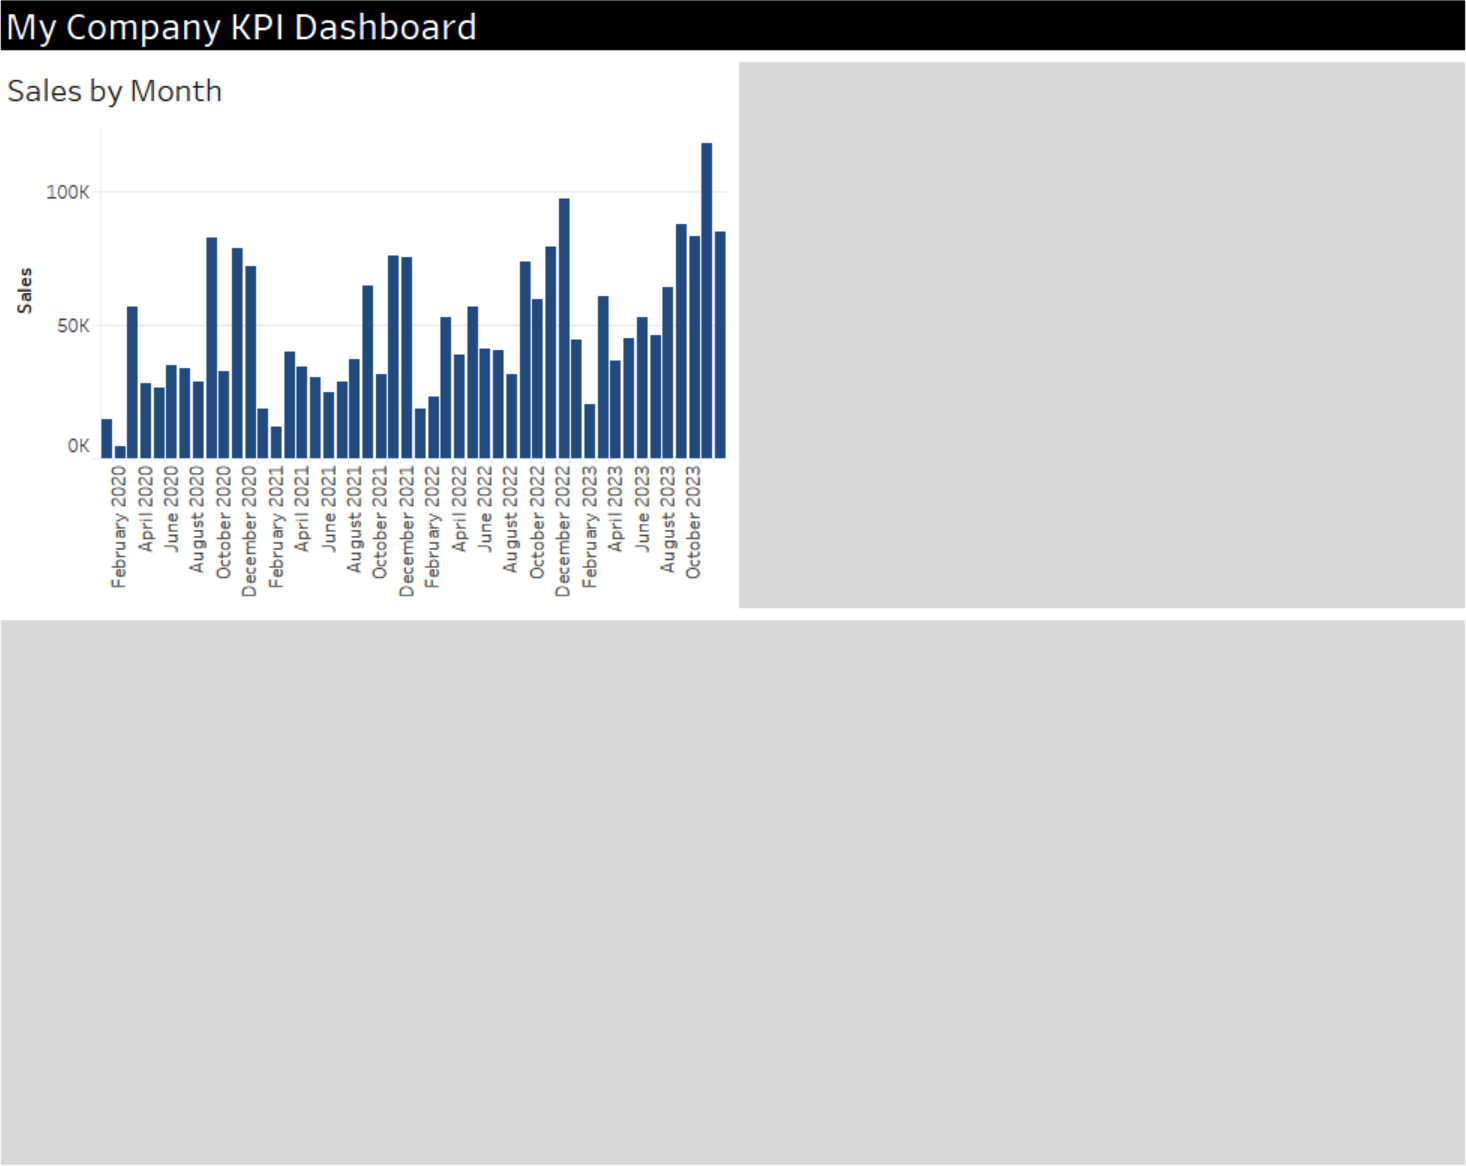
After staring at your chart for a few minutes, you realize that it would look better and you’d have more room for the visualization if you cut down the size of the date labels. Tableau provides formatting to make dates appear in many different ways, and you want one that looks like “Nov-21.” You return to your sheet, right-click on the pill, and choose the Format option. In the Format window is a date format option, perfect! You click the date format, and are met with disappointment. There is only one option available to you, as shown.
Tableau has two types of fields—discrete and continuous. Discrete fields are chunks of something whereas continuous fields are a range. For example, the Categories field has unique, defined groupings and is discrete; ...
Read now
Unlock full access


 O’Reilly covers everything we've got, with content to help us build a world-class technology community, upgrade the capabilities and competencies of our teams, and improve overall team performance as well as their engagement.I wanted to learn C and C++, but it didn't click for me until I picked up an O'Reilly book. When I went on the O’Reilly platform, I was astonished to find all the books there, plus live events and sandboxes so you could play around with the technology.I’ve been on the O’Reilly platform for more than eight years. I use a couple of learning platforms, but I'm on O'Reilly more than anybody else. When you're there, you start learning. I'm never disappointed.I'm always learning. So when I got on to O'Reilly, I was like a kid in a candy store. There are playlists. There are answers. There's on-demand training. It's worth its weight in gold, in terms of what it allows me to do.