Chapter 7. A Quick Application Monitor Tour: Active and post analysis 217
7.2 Analyzing an active job
1. For our tour, we are just going to analyze an active job. So we select option 1 as shown in
Figure 7-2.
Figure 7-2 The main menu selecting option 1
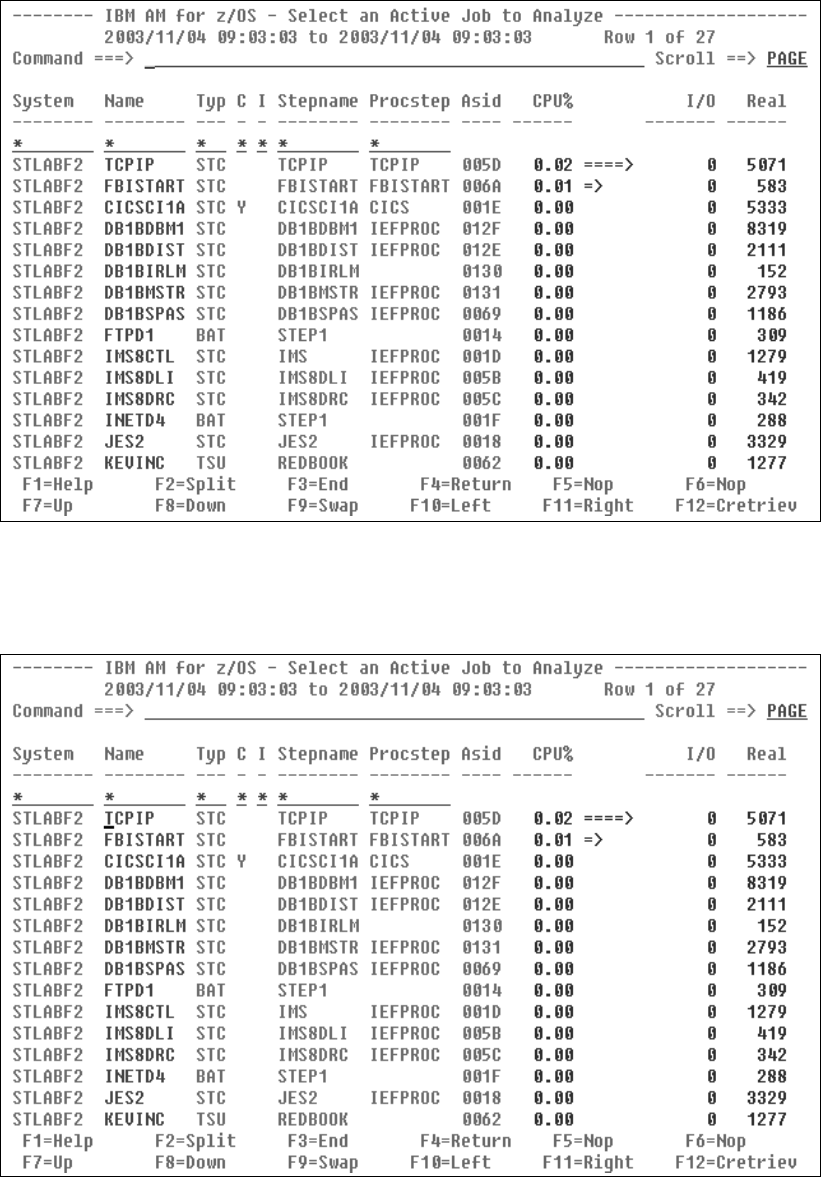
2. Figure 7-3 shows the active jobs in the system by decreasing CPU percentage.
Figure 7-3 The panel showing active jobs

218 Using IBM Application Development Tools for z/OS and OS/390
3. The data is constantly being gathered, so it will be updated when you press Enter. Note
that after you press Enter, FBISTART, which is part of Application Monitor’s monitoring
code, moves up to second place. You will also notice that the system is rather empty, with
TCPIP using the most CPU at 0.02% as shown in Figure 7-4.
Figure 7-4 An update on the active job status
4. The pale blue fields on the screen are selectable. We put our cursor on TCPIP and press
Enter to indicate that we want to monitor the TCPIP job as shown in Figure 7-5.
Figure 7-5 Selecting the TCPIP job

Chapter 7. A Quick Application Monitor Tour: Active and post analysis 219
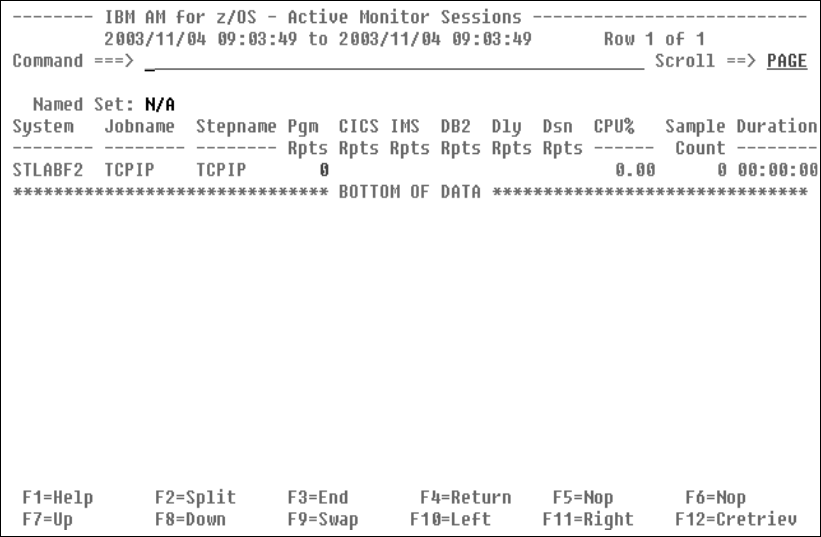
5. This brings up the active monitor sessions window as shown in Figure 7-6. If another
session were being monitored (for example, started with a delayed monitoring session), it
would also appear in this window.
Figure 7-6 The active monitor sessions panel
6. The information is collecting constantly, and if you press Enter, the fields will be updated.
The Sample Count field indicates how many samples have been taken so far, and the
Pgm Rpts field indicates how many modules have been encountered during the sampling.
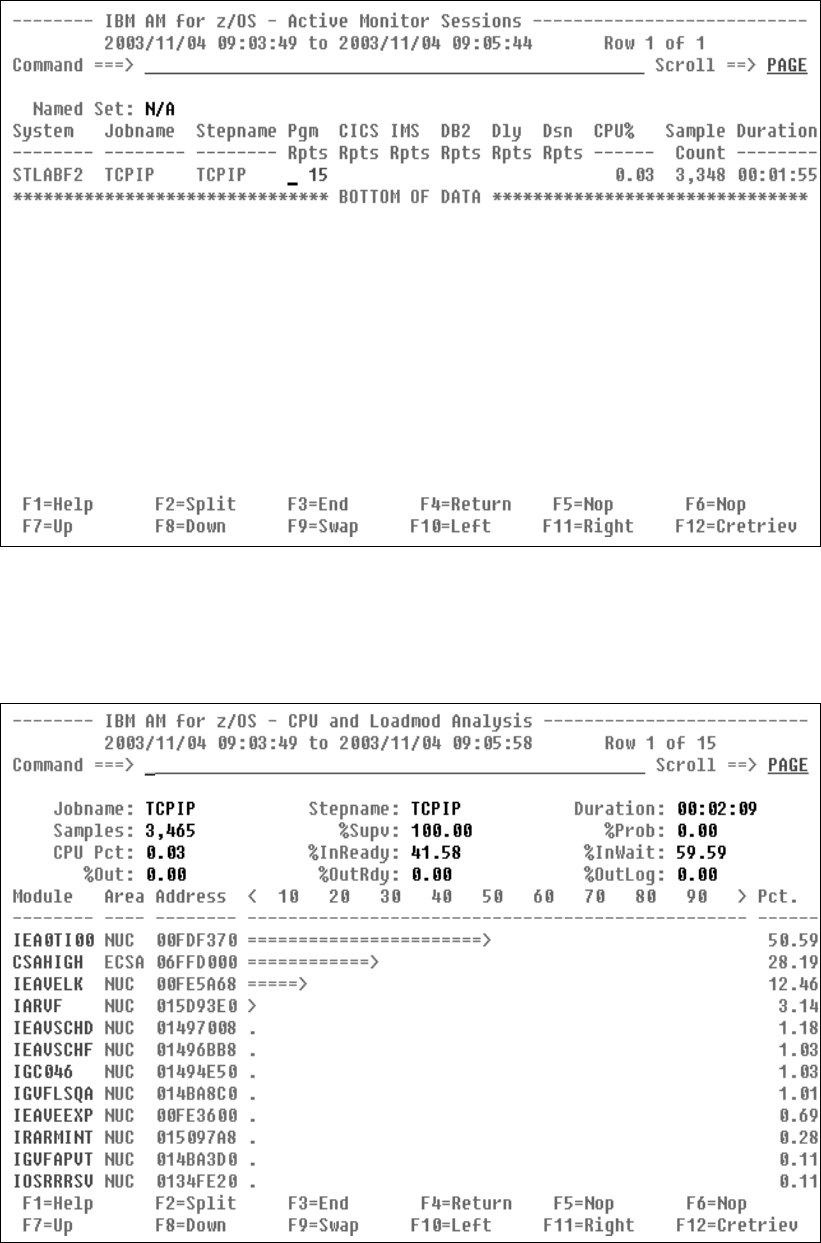
Once the Sample Count and Pgm Report numbers are reasonably high, put the cursor on
the pale blue Pgm Rpts field for the job you want to analyze in detail and press Enter as
shown in Figure 7-7. We selected the Pgm Rpts for TCPIP.

220 Using IBM Application Development Tools for z/OS and OS/390
Figure 7-7 Selecting Program Reports on the Active Monitor Sessions panel
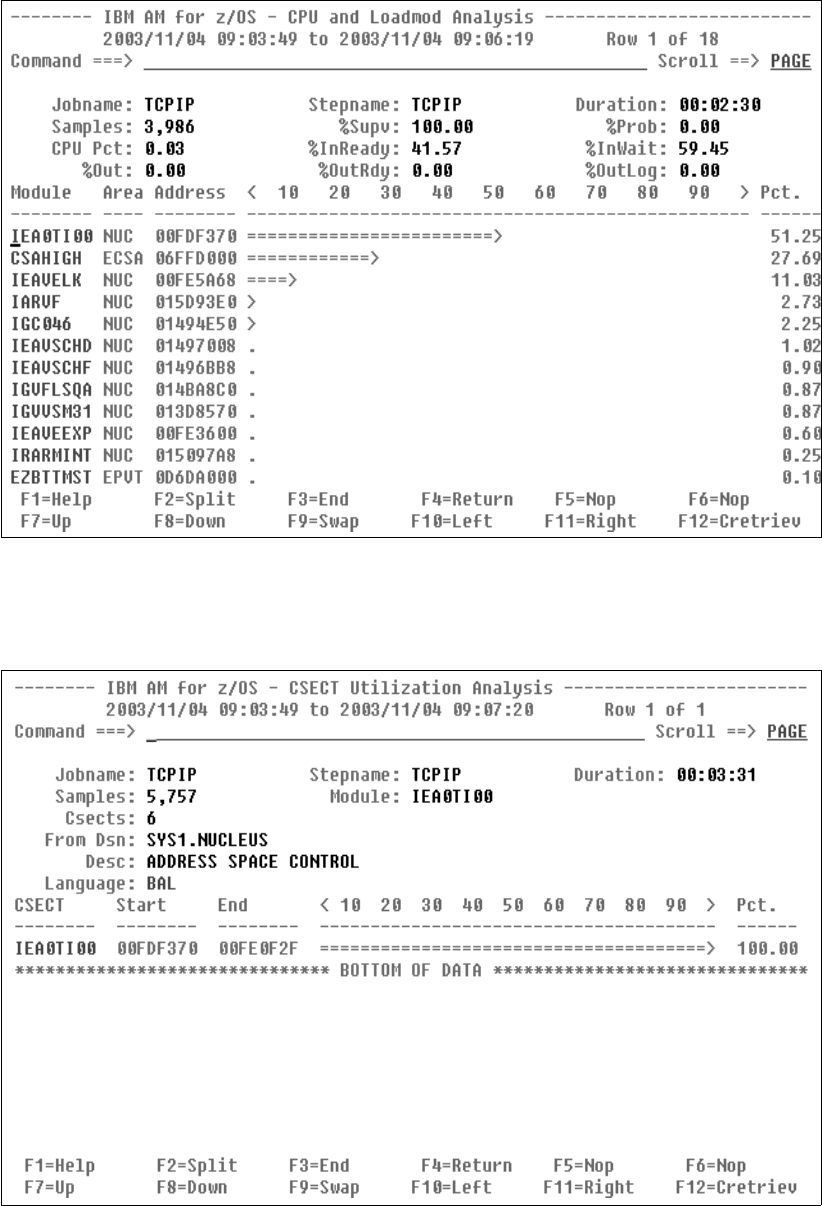
7. Figure 7-8 shows the modules that have been monitored, in decreasing order of
frequency. Again, the data will be updated on the fly each time you press the Enter key.
You can page up (F7) and down (F8) to look at the full list of modules.
Figure 7-8 Load module based breakdown of the TCPIP job

Chapter 7. A Quick Application Monitor Tour: Active and post analysis 221
8. The modules in the module column are pale blue and therefore selectable to get further
information. We select the high use module at the top of the list as shown in Figure 7-9.
Figure 7-9 Selecting a load module to analyze
9. Figure 7-10 shows detailed information on each CSECT in the module and their utilization.
In this module there is only one CSECT.
Figure 7-10 The CSECT breakdown of the selected module
Get Using IBM Application Development Tools for z/OS and OS/390 now with the O’Reilly learning platform.
O’Reilly members experience books, live events, courses curated by job role, and more from O’Reilly and nearly 200 top publishers.

