Chapter 9
JMP Reports
Navigate and Customize Report Windows
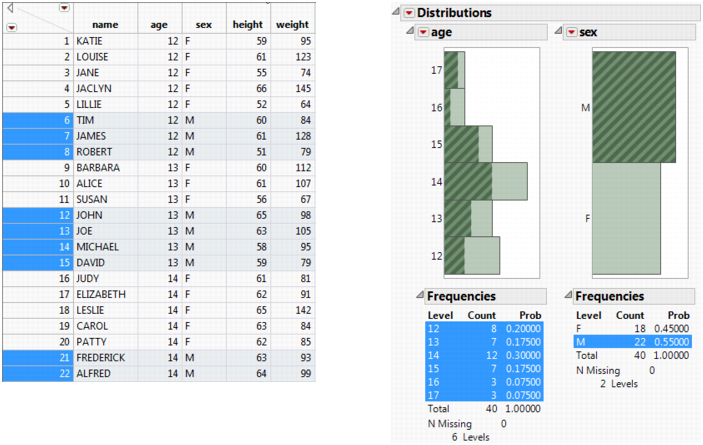
Most JMP platforms present the results of your analyses in a report window. The report window consists of graphs and statistical reports that are often linked to the data table. When you select data in the graph or report, the data is highlighted in the data table. Figure 9.1 shows an example of selected data in a report window and in a data table.
This chapter describes how to customize the colors, lines, data points, and other graphical elements in a report window.
Figure 9.1 Example of a JMP Report Window and Data Table
Get Using JMP 13 now with the O’Reilly learning platform.
O’Reilly members experience books, live events, courses curated by job role, and more from O’Reilly and nearly 200 top publishers.

