Chapter 15
Embedded Visualizations
An embedded visualization, as the name suggests, is a visualization that is contained within some other content—typically, this table of data will be that most widely used of visualizations. Indeed, this book has made extensive use of this approach in the tables contained within every chapter, with indicators showing the ease of implementation. It is also possible to do these visualizations within a flow of text or perhaps within an application—but they are much less common. An example of an indicator embedded within an application is shown in Figure 15-1.
Figure 15-1: Visualizations embedded in an application
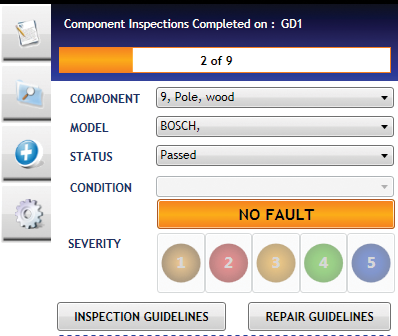
In this case, the indicators are being used as buttons that can be clicked on to set a status.
Common uses for embedded visualizations include highlighting problems such as highly divergent numbers that are likely to be a data-capture error, and ranking of various numbers such as all the stores within a region. Covered much more extensively in Chapter 10, indicators showing achievement against a target are another form of embedded visualization. Another great use is the ability to show multiple small charts, thereby allowing for a great deal of data to be displayed on a single page.
In this chapter, we will focus on the traditional tabular embedded visualizations—formatting of the table itself, embedding charts within cells in a table, ...
Get Visual Intelligence: Microsoft Tools and Techniques for Visualizing Data now with the O’Reilly learning platform.
O’Reilly members experience books, live events, courses curated by job role, and more from O’Reilly and nearly 200 top publishers.

