Chapter 16
Other Visualizations
Throughout this book you have learned about visualizations that you can implement using the Microsoft stack, and how to implement them. In this chapter you learn about other visualizations—many of these are not data-driven; instead, they are often drawn by artists or handcrafted by other professionals.
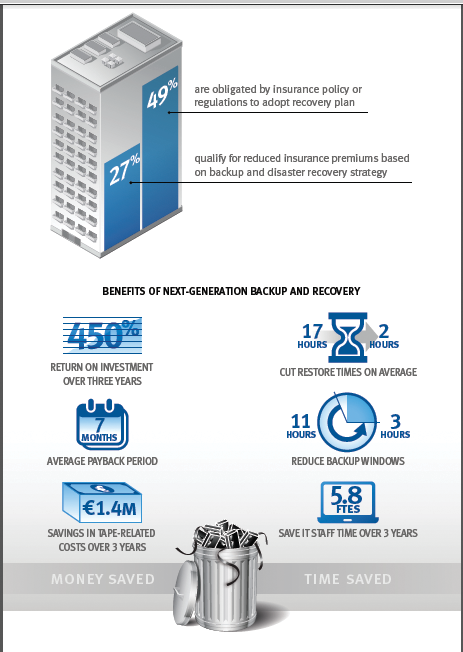
Figure 16-1: An infographic promoting next generation backup and recovery
Traditional Infographics
As discussed at length in Chapter 1, data driven visualizations and infographics are very different in function, and they are often different in form as well. An infographic is typically static—in other words, if the data changes, the infographic doesn’t update. Many infographics are simply images rather than being interactive.
An infographic is often used to tell a single story, with imagery chosen to fit that story. It might have numeric values attached to the images. An example infographic is shown in Figure 16-1.
Periodic Tables
Mendelev’s periodic table of the elements was a revolution in understanding of the elements—not just as a visualization, but also because he used the atomic weight—that is, how many protons were in the atom—as the underpinning, and isotypes are simply versions of the same element. The effect of the way Mendelev laid out the table cannot be overstated. As shown in Figure 16-2, being able to read the group (for example, beryllium ...
Get Visual Intelligence: Microsoft Tools and Techniques for Visualizing Data now with the O’Reilly learning platform.
O’Reilly members experience books, live events, courses curated by job role, and more from O’Reilly and nearly 200 top publishers.

