Chapter 8. Visualization Components

Components are the discrete blocks of applied elements that are used in visualizations. This chapter covers some common visualization components with a streaming data update.
Records
By the time records are being shown to an analyst, they should have some level of structure applied to them, using the methods mentioned in Chapter 5. The more structure is applied to them, the easier it will be to organize and create rules about them.
At some point in a streaming data client, you will need to display raw records and allow someone to add context or make decisions about them. This can be challenging when you have way more records than can ever be interpreted by one person, and each one may take an entire screen to display. The goals are typically as follows:
Show as many records as possible to the analyst at once.
Format the records in a readable way.
Show the analyst only information that is relevant to what they are trying to accomplish.
Add visual cues to records that help the analyst quickly notice significant details.
Manage the speed of the data so that they can digest it.
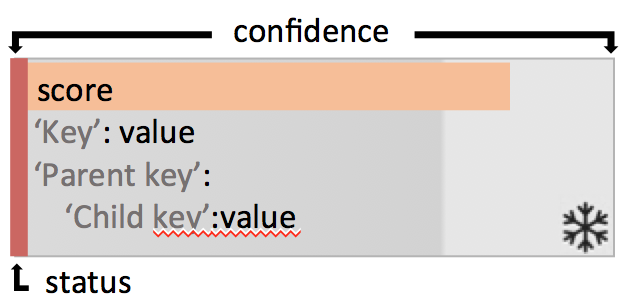
Figure 8-1 shows an example of a record with such visual cues.

Figure 8-1. Example record presentation with visual cues
We can accomplish these goals with the following ...
Get Visualizing Streaming Data now with the O’Reilly learning platform.
O’Reilly members experience books, live events, courses curated by job role, and more from O’Reilly and nearly 200 top publishers.

