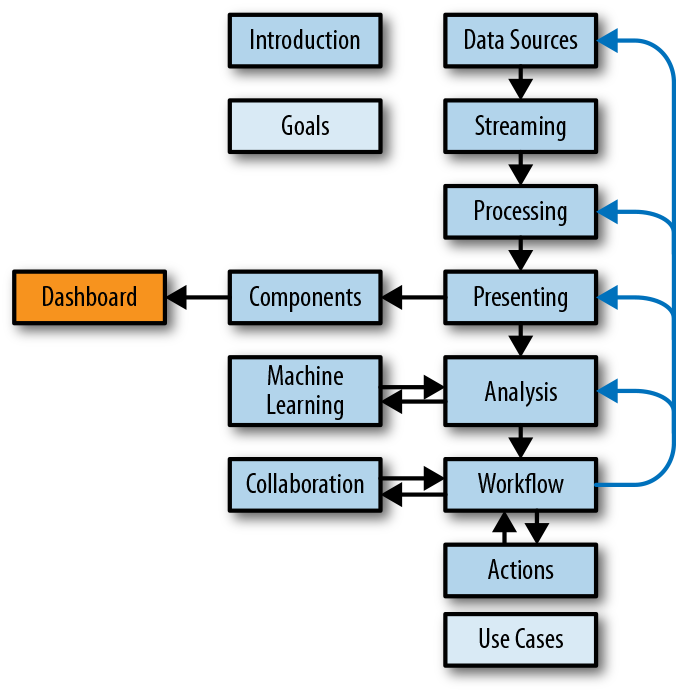
Chapter 11. Streaming Data Dashboard

The dashboard is where it all comes together. This is the primary point for an analyst to make a decision as to what requires or deserves more attention. The goal of a dashboard should be to give the analyst enough information to make that decision as quickly as possible. A dashboard is supposed to be able to give you a sense of awareness at a glance, but with streaming data it can take a little more time to see the patterns in what’s occurring and determine whether the movement and patterns are significant. The more thought you give to where your components are placed and how they are coordinated with each other, the better your outcome will be. Enabling analysts to choose and place any items they want on a dashboard allows greater flexibility, but success may vary, especially with streaming data. With more going on at once, it’s more important to be intentional, with everything toward a goal. This may result in you needing to create several dashboards to meet the various needs of your audience.
Layout
The layout is the overall organization of elements in your dashboard. The analyst should be able to get a sense of an item’s order, category, and priority of information just by where it appears in in the layout in relation to other items.
- Columns
-
Using column containers for organizing content is pretty natural for landscape screen layouts. ...
Get Visualizing Streaming Data now with the O’Reilly learning platform.
O’Reilly members experience books, live events, courses curated by job role, and more from O’Reilly and nearly 200 top publishers.

