Chapter 15. Use Cases

There’s no limit to the use cases that are a good fit for visualizing streaming data. Some stand out as ones that immediately make sense and are being used in some capacity today. The common criteria for appropriate use cases are as follows:
There is value in knowing the recent history, order, and frequency patterns.
There is a time-critical element.
An analyst can get more insight by seeing it in motion.
Here we will look at a few examples of use cases that I have run across or found.
Security
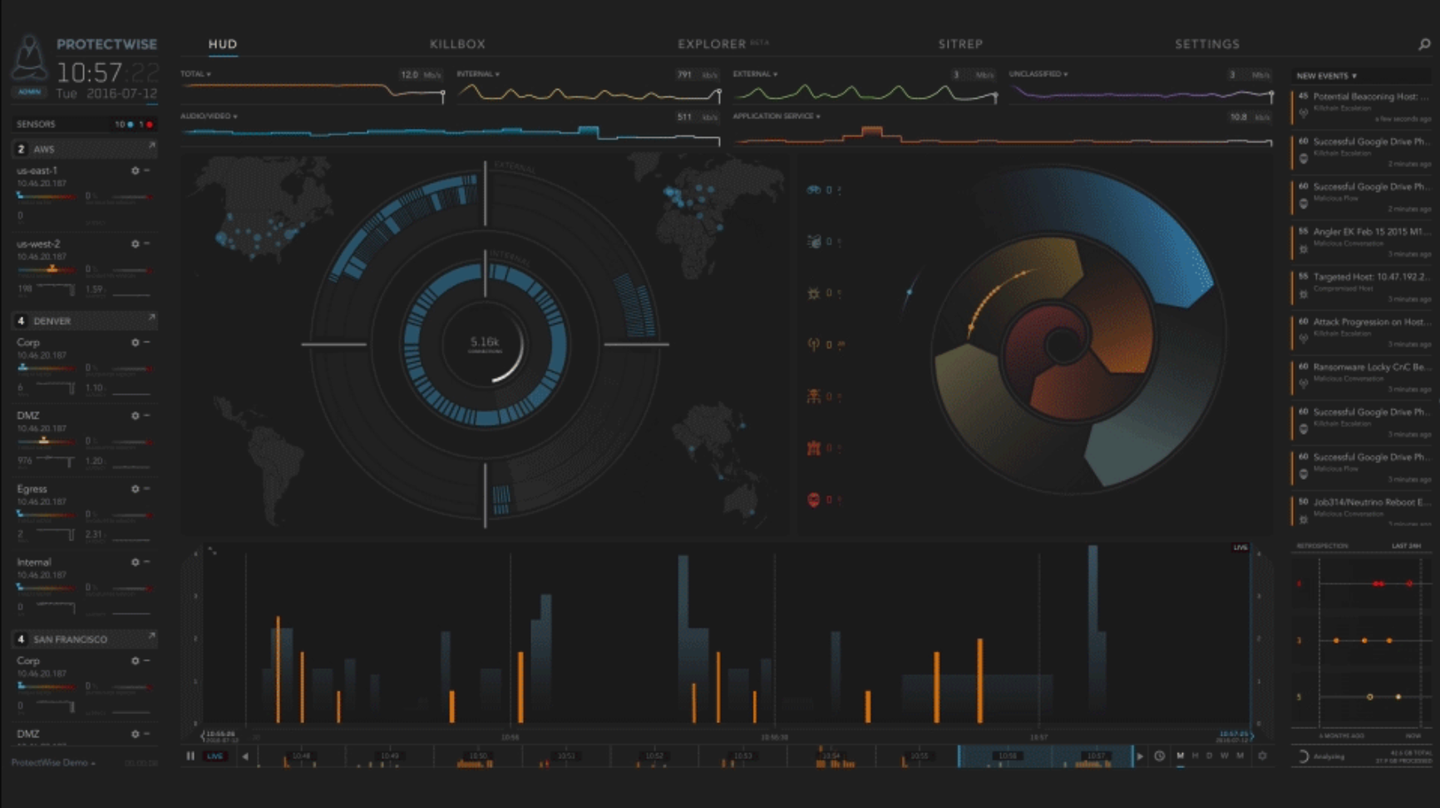
In all areas of security, there’s a high value in being timely. The sequence order and frequency of alerts can also have meaning. In computer security in particular, there’s an overwhelming amount of data to consume, and new perspectives and methods are always welcome. Visualizations can help us understand the relationships between and timelines of various threats. Security data additionally often requires secondary lookups for history and context that can also be shown in a streaming visualization.
Figure 15-1 is an example of a streaming visualization used in security.

Figure 15-1. Interactive streaming visualization for security monitoring (source: https://www.protectwise.com/platform.html)
Machine Learning Interaction
Artificial intelligence and machine ...
Get Visualizing Streaming Data now with the O’Reilly learning platform.
O’Reilly members experience books, live events, courses curated by job role, and more from O’Reilly and nearly 200 top publishers.

