Resizing the google chart
So far, it was so simple. However, there is a problem!
Google vis charts, unlike native R visualizations, are not automatically resized when the browser window changes. We're going to fix this problem very simply using session$clientData, which we came across at the beginning of the chapter. If you are running the application, click on the Show client data button at the bottom of the application. The following screen will appear:
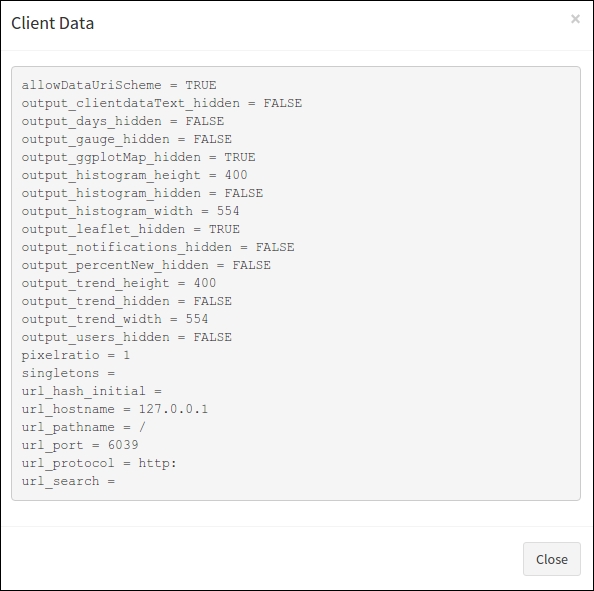
In order to redraw the gauge, we are going to establish a dependency on one of these elements that we know will change when the size of the browser window changes. In this case, output_trend_width ...
Get Web Application Development with R Using Shiny - Second Edition now with the O’Reilly learning platform.
O’Reilly members experience books, live events, courses curated by job role, and more from O’Reilly and nearly 200 top publishers.

