862 WebSphere Business Integration Adapters
15.The list of process instances that are available displays, based on the filter
with the Business Measures that you selected.
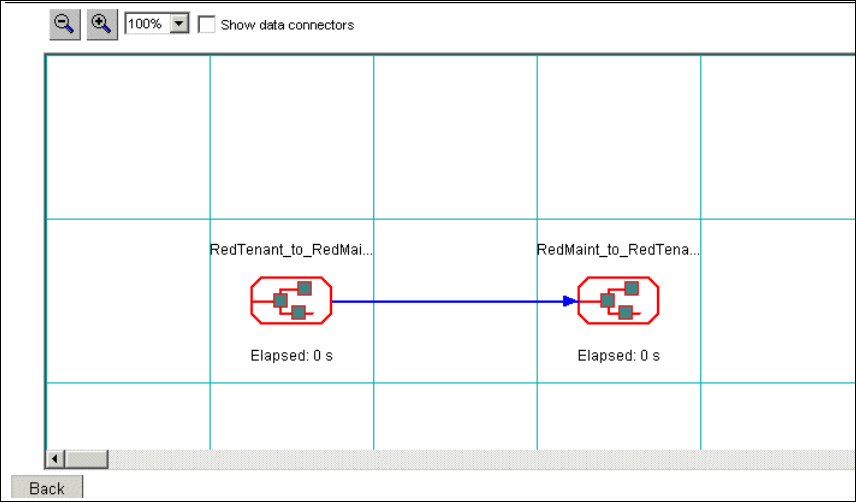
16.If you click the Process Diagram icon, you see the graphical representation of
the process model, as shown in Figure 32-36. Note this is a V4.2.4
representation.
Figure 32-36 Process diagram
17.Run some more processes to check the real-time updates from the Emitter.
Chapter 32. Gathering data from the run-time 863
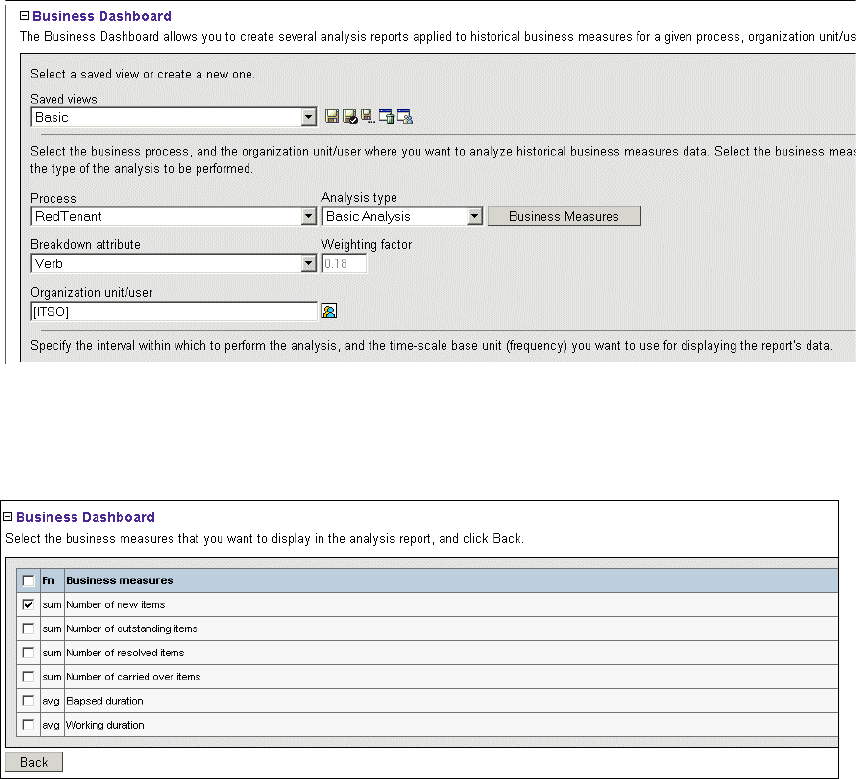
32.5.2 Business Dashboard
To start the Business Dashboard:
1. Select Configuration View in the Business Dashboard (Figure 32-37).
2. Using the drop-down list, select the RedTenant process.
3. Select an analysis type. We chose Basic Analysis.
4. Click Business Measures.
Figure 32-37 Create view
5. Select a business measure as the basis for the analysis. We chose Number
of new items, as shown in Figure 32-38.
Figure 32-38 Select business measure
864 WebSphere Business Integration Adapters
6. Click Back.
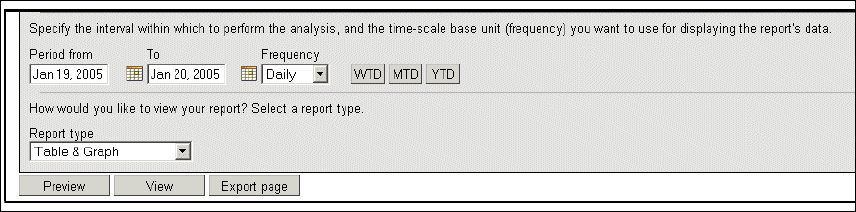
7. Select a breakdown attribute. We chose Verb because we want to see an
analysis of historical data that is based on the number of new items per day,
by verb.
Figure 32-39 Select date range
8. Move down the screen (Figure 32-39). Select an interval for reporting. We
chose YTD so that we can see everything that we have created so far.
9. Select a report type. We chose Table & Graph.
10.Go back up to the top and save this view. We saved it as Basic.
11.Go to the Views view.
12.Select the newly saved view.
13.Click View to run the query.
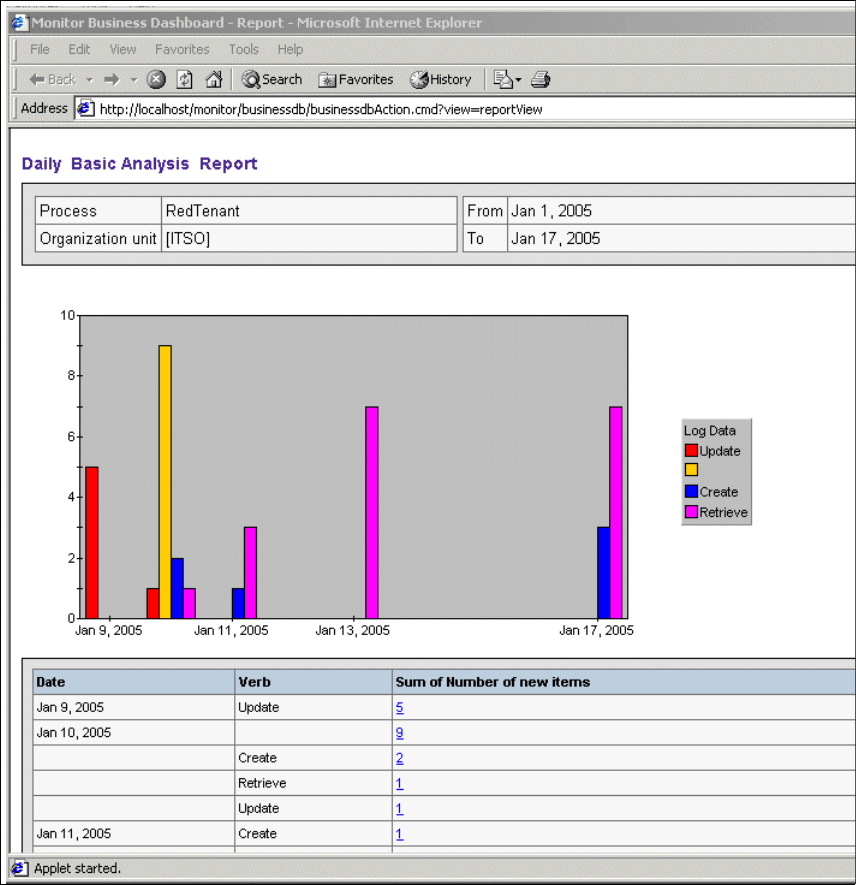
When you have fed your Monitor over a period of time, you see a report similar to
that shown in Figure 32-40 on page 865. This particular report is a snapshot of
our testing the emitter over a few days.
Chapter 32. Gathering data from the run-time 865
Figure 32-40 Daily Basic Analysis Report
866 WebSphere Business Integration Adapters
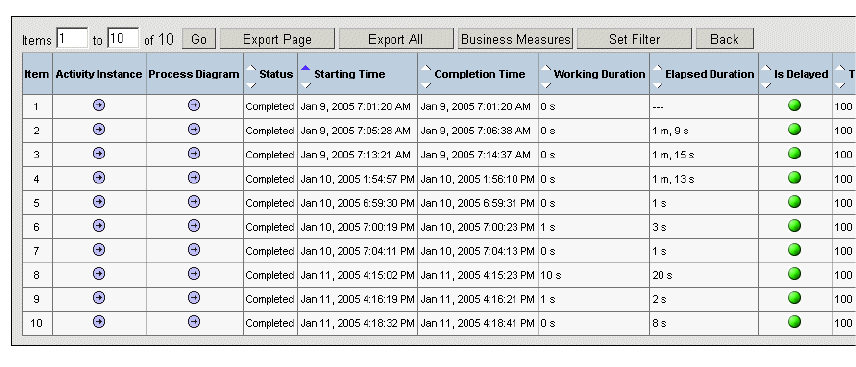
As before, you can drill down for a more detailed analysis (Figure 32-41). You can
set filters or export the data as a CSV file to be used in reporting packages,
spreadsheets and so forth.
Figure 32-41 Report details
This is not a particularly elegant use of the Monitor. We do not gain any real
business metric benefit from it by our use of business measures, except for a trail
of how many tenant and maintenance operations we are processing. However,
we have achieved what we set out to do. We wanted to be able to add our
Adapters solution into the Monitor for visibility, and we have done that.
Get WebSphere Business Integration Adapters: An Adapter Development and WebSphere Business Integration Solution now with the O’Reilly learning platform.
O’Reilly members experience books, live events, courses curated by job role, and more from O’Reilly and nearly 200 top publishers.

