
 Battle of Lights, Coney Island, Mardi Gras - Joseph Stella (source: Yale University Art Gallery)
 Executive Summary
THIS REPORT EXPLORES THE LANDSCAPE of the professionals
working in all facets of software development, including
details about the relationship between roles, location,
company size, industry, and earnings. The results are based
on more than 6,800 responses collected via an online survey.
We paid special attention to the variables that correlate with
salary, but it’s not just about money: we also analyzed what
tools, tasks, and organizational processes respondents most
commonly use.
In this, our second annual Software Development Salary
Survey, we find some consistency in what matters to software
developers. Much like last year, our results show that the
better-paying jobs tend to concentrate in tech centers, that
experience matters more than age, and that knowing more
tools, working with more people in a wider variety of roles,
and working for larger organizations all correlate with higher
wages. And, the data shows that knowing when to hold ’em
and when to fold ’em (i.e., self-reported good negotiating
skills) might be a key to higher salaries.
The median salary this year was down worldwide compared
to last year, likely caused by a drop in the share of highly
paid US-based respondents and a currency exchange-based
decline for Western Europeans who made up a larger share of
survey participants compared to last year.
Other key findings from this report include:
US respondents, particularly those in California, report the highest salaries.
The larger the company, the higher the reported salaries (the small cohort of one-person organization is an exception, with reported salaries higher than respondents at organizations with less than 1,000 employees).
Compared to last year, there was no real salary change for respondents working at large companies.
Software industry respondents (by far the largest share of survey participants) and consultants reported the lowest median income.
Those self-reporting a high level of negotiating and bargaining skills also reported the highest median incomes.
As with the other salary surveys we’ve run, those attending the most meetings—a proxy for higher levels of responsibility—report the highest incomes.
We hope that you will find the information in this report
useful. If you can spare 5–10 minutes, go take the survey
yourself: http://oreilly.com/programming/2018-programming-salary-survey.html.
Note
You can download last year’s survey from http://oreilly.com/ideas/2016-software-development-salary-survey-report.
Introduction
THE RESULTS FROM O’REILLY’S SECOND ANNUAL
SOFTWARE DEVELOPMENT SALARY SURVEY ARE IN.
This anonymous online survey ran last fall and winter and attracted
more than 6,800 programmers, tech leads, managers,
and students—an increase of more than 1,000 respondents
compared to 2016. The respondents were from 110 countries,
including all 50 US states and the District of Columbia.
Use data from the report to compare yourself to others at
similar companies and positions, and find out what roles,
tools, work styles, organizational skills, and work environments
correlate with the highest salaries.
If you are looking to change jobs, about to have your annual
employee review, or moving to a new town, this report will
help you benchmark your skills and salary expectations. You’ll
learn where you fit and how you might leverage these potentially
career-changing findings.
Note
When calculating salary values, we omitted responses from
people who identified themselves as students (about 6.5% of
respondents) to offset the negative skew on reported earnings
from those trying to balance part-time or full-time work with
their academic load. All salary numbers in this report exclude students,
but student responses are used in some charts to compare
skills and tools used by students versus professionals.
Salary Overview
COMPARED TO THE 2016 SURVEY, SALARIES ARE
DOWN ABOUT $10,000 despite an increase in salaries from
US respondents. Here’s what’s behind this drop:
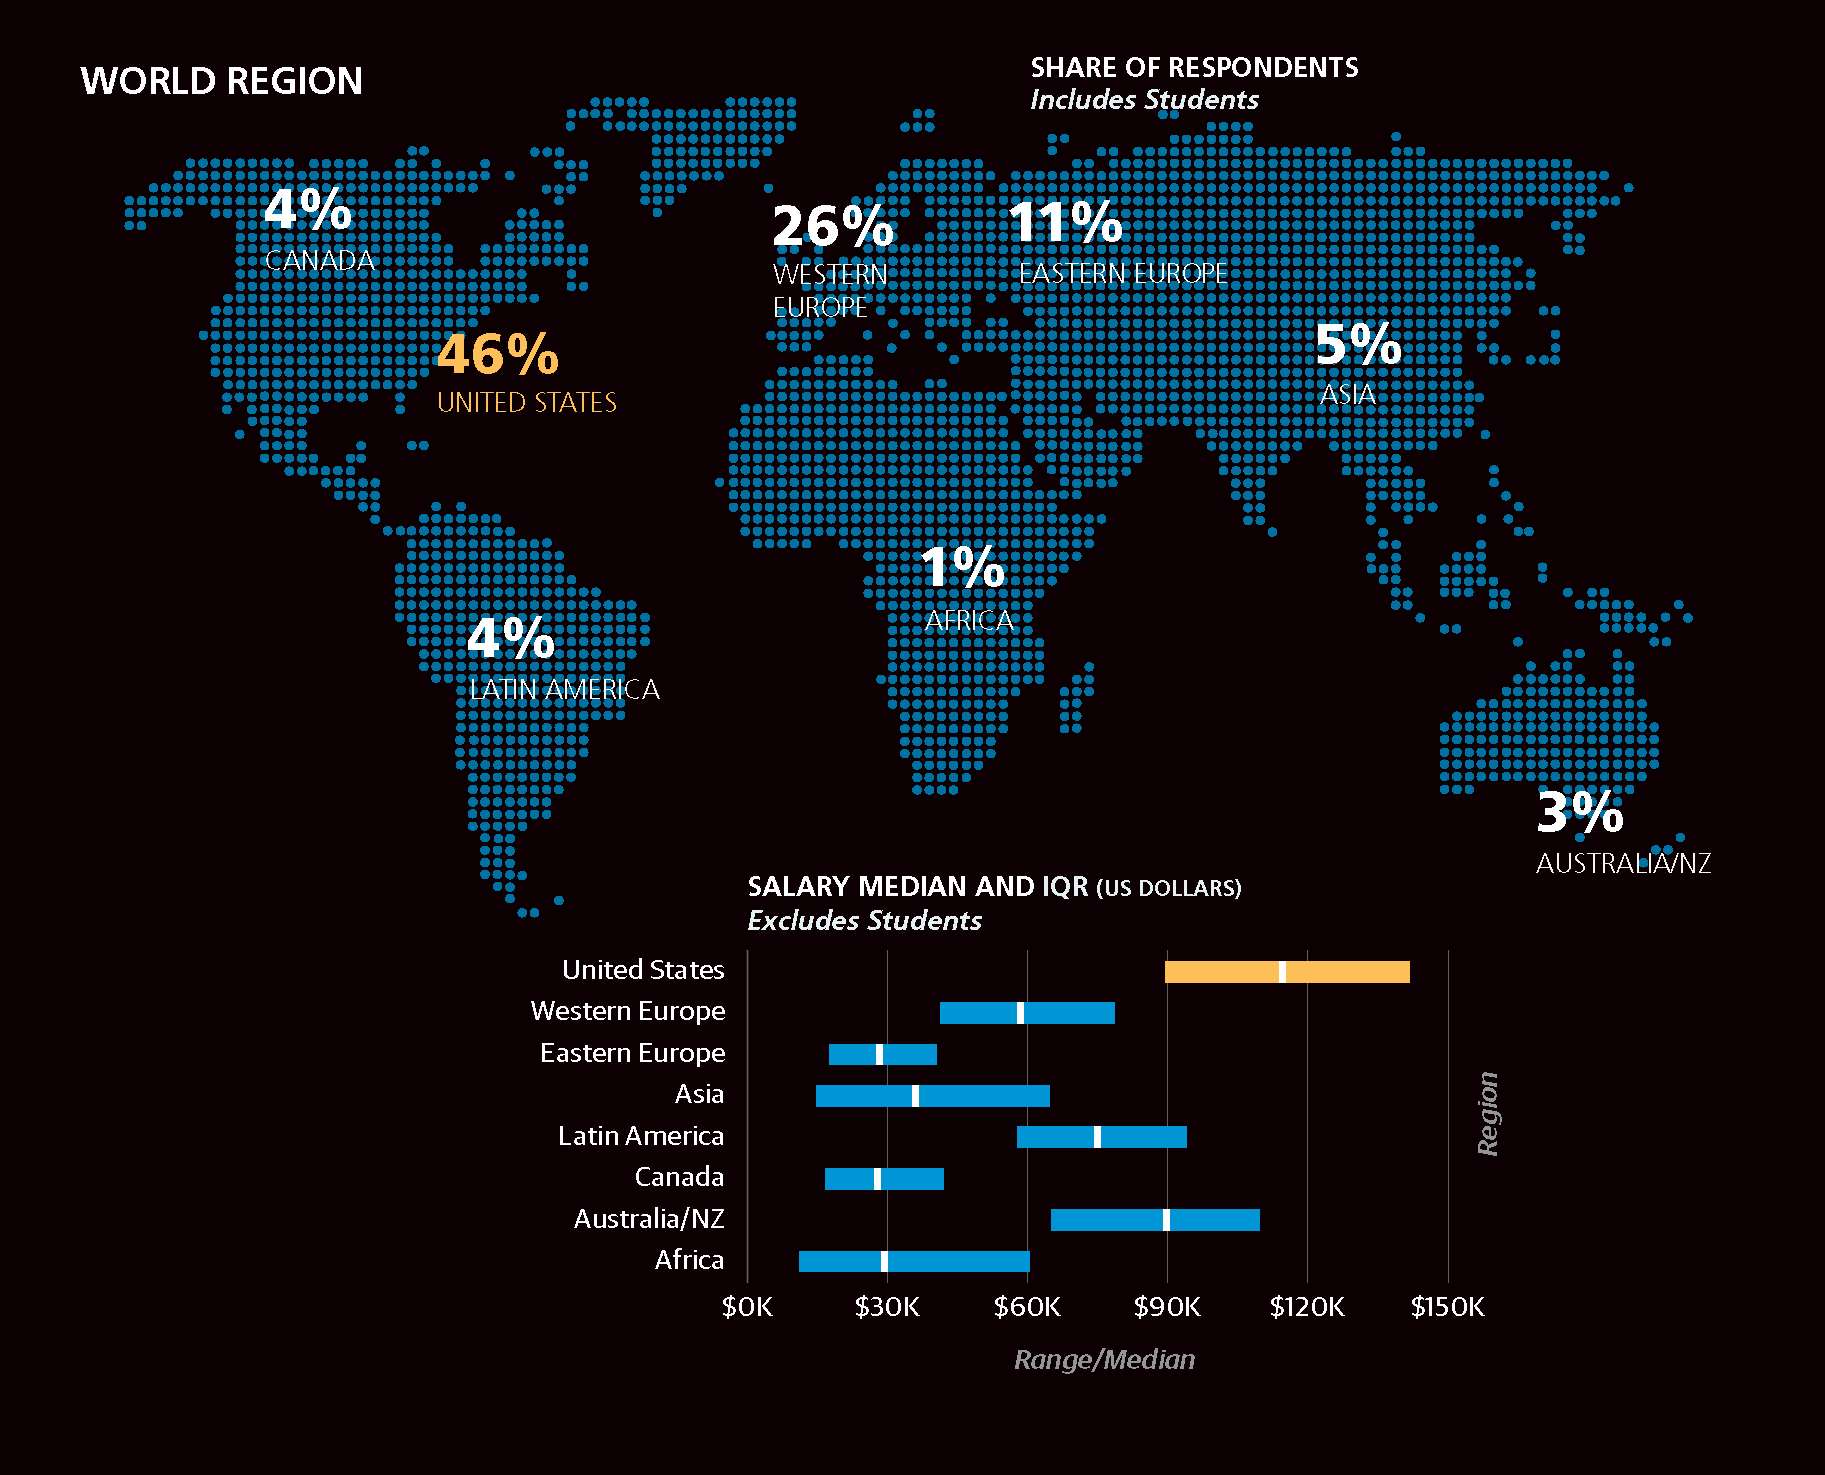
US respondents report much higher median salaries than the rest of the world: $115K in 2017, up about 5% over 2016.
The share of US respondents dropped from 61% to 46% of our total.
Western European respondents reported lower salaries ($58K), nearly 7% lower than what was reported last year.
European salaries were effectively reduced by the rising value of the US Dollar compared to the British Pound (up 16%) and Euro (up 8%) compared to 2016.
The share of Western European respondents increased from 20% to 26%.
Note
US respondents report
much higher median
salaries than the
rest of the world.
Countries with varying supply and demand conditions, different
healthcare and tax regimes, volatile exchange rates, and other factors all make comparing salaries worldwide difficult
at best. For a non-numerical perspective on salaries, we
asked respondents to rate their satisfaction with their salaries.
Despite the differences in salaries by
country and region, about 50% of the
non-student respondents were satisfied,
31% were neutral, leaving only
about 20% unhappy with what they
make.
Students show a less happy picture,
with 37% positive toward their salaries,
29% neutral, and 34% unhappy.
The most unsatisfied student group
seem justified in their gloom, with a median salary of just
over $11K!
Note
In the horizontal bar charts throughout this report, we include
the interquartile range (IQR) to show the middle 50% of
respondents’ answers to questions such as salary. One quarter
of the respondents has a salary below the displayed range,
and one quarter has a salary above the displayed range.
Geography
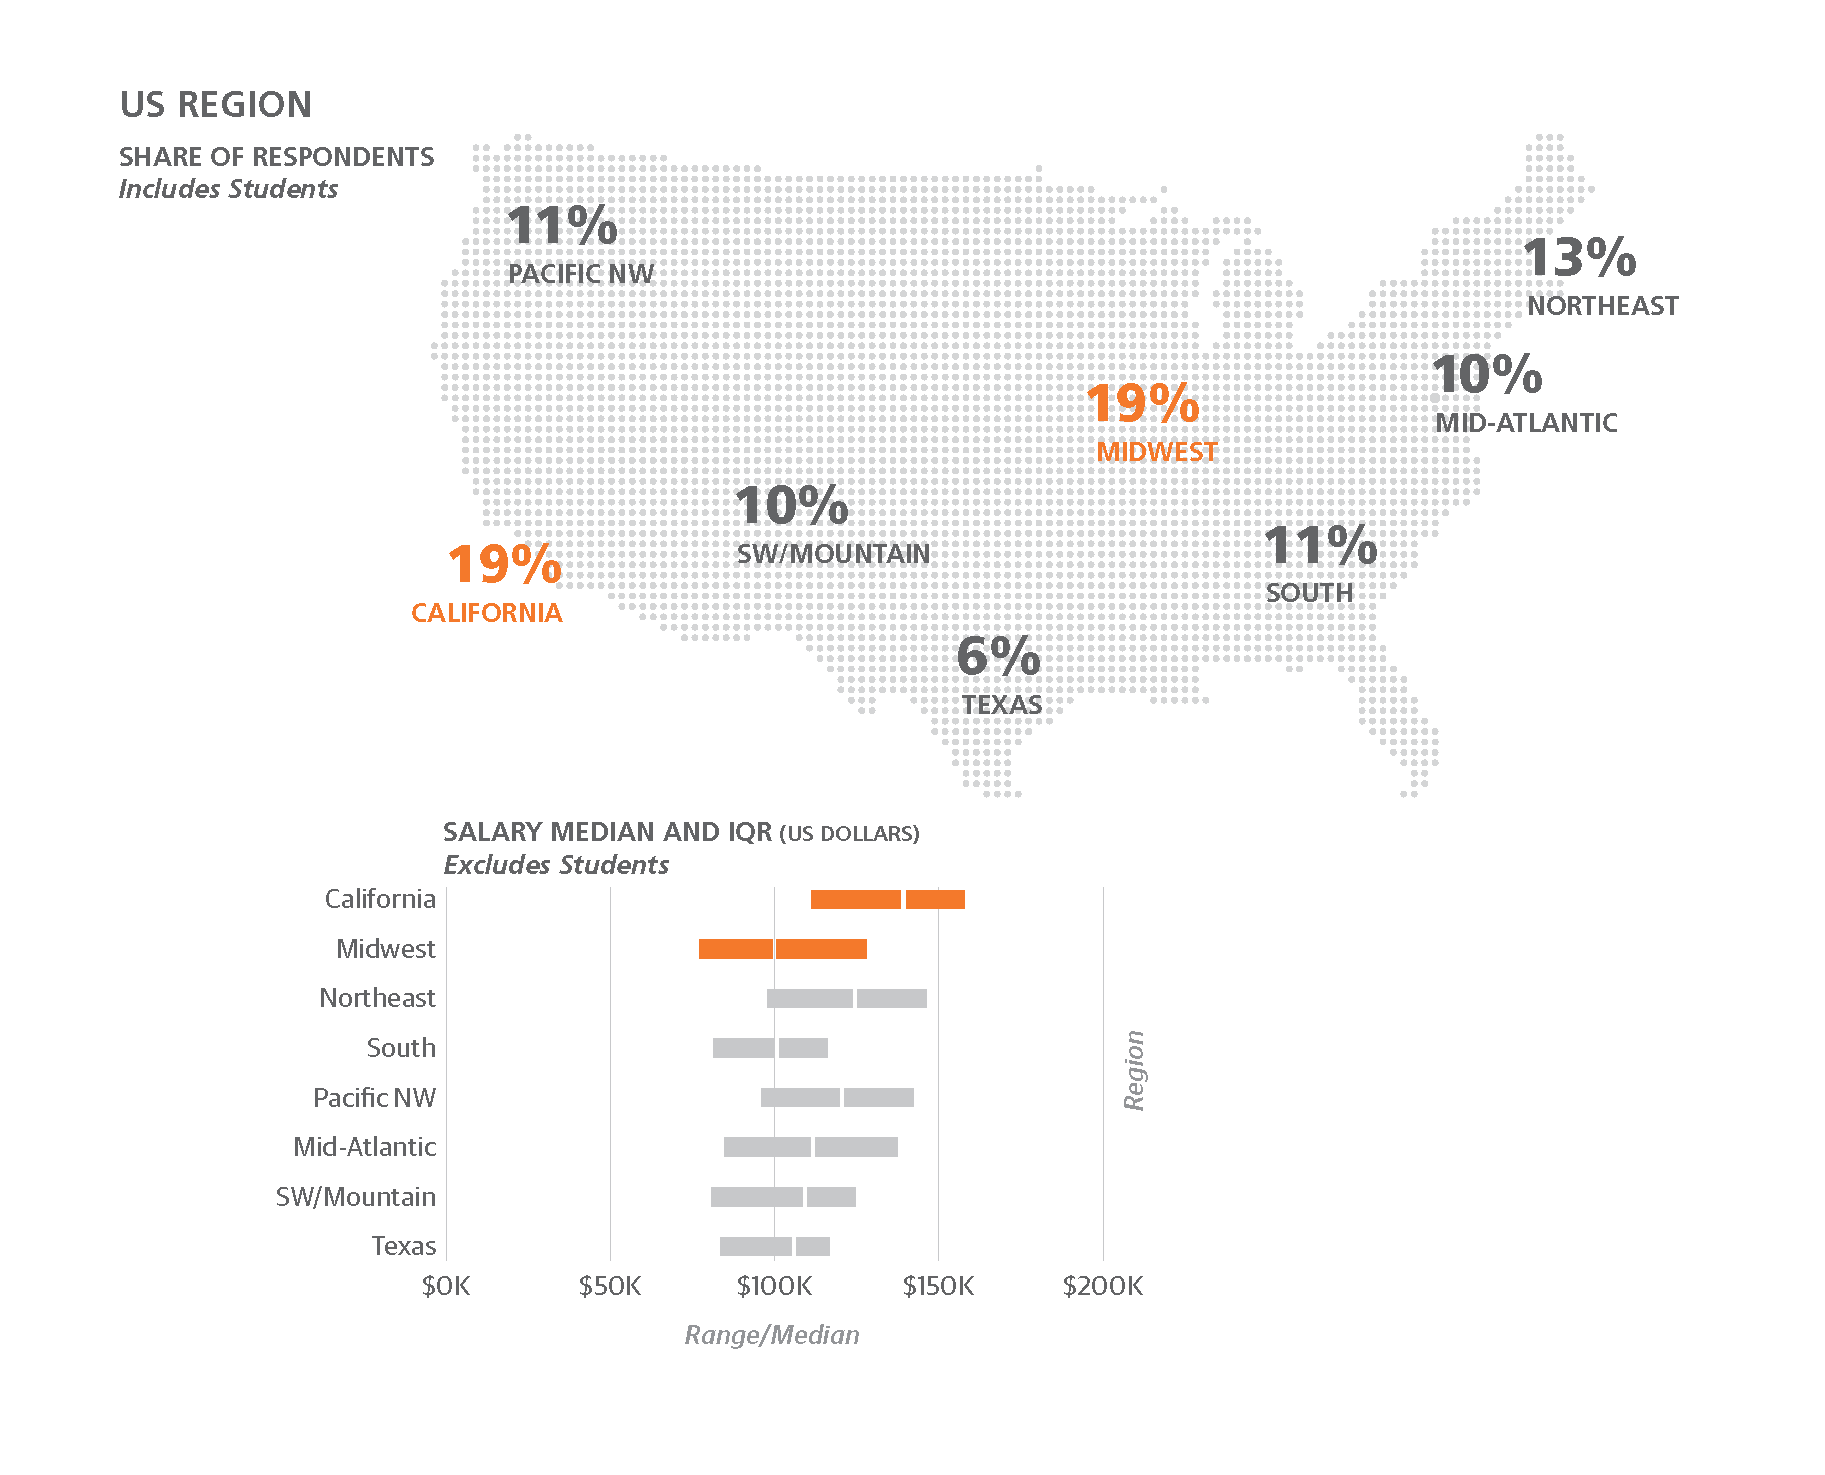
CERTAIN REGIONS ARE OUTLIERS WHEN IT COMES
TO SALARY. For example, within the US, the West Coast has
a higher median salary than other parts of the country, likely
due to the concentration of tech
companies in the Silicon Valley area.
California salaries are $15–$20K
higher than any other part of the
US, with a median of $139K. The
northeast has the next highest
salaries, with $124.5K median, and
the Pacific Northwest follows at
$120K median. These US regions
are home to other big technology
hubs: cities like New York and Boston in the Northeast, and
companies like Amazon and Microsoft in the Northwest.
The Midwest is the lowest-paid region of the United States
(if you ignore “other”), but even it doesn’t do too badly. The
median salary is almost $100K, and Texas alone is $106K.
There is a stark difference between the US, with a
median salary of $115K and the rest of the world. The
next closest region, Australia/New Zealand, comes in
nearly 22% less at $90K, Western
Europe shows a median of
$60K, and in Eastern Europe we
see only $28K. Factors like the
differences in cost of living, local
demand for tech talent, respondent
experience, and taxes help
explain the wide range of salaries
for developers.
Some of the regional salary
discrepancies could be caused by respondents incorrectly
performing currency conversions, or doing no conversion at
all. For example, reporting 30K British pounds as 30K USD
would lower the averages.
Note
California salaries are
$15–$20K higher than any
other part of the US, with a
median of $139K.
Company Size
OUR RESULTS SHOW THAT THE BIGGER THE COMPANY,
THE HIGHER THE SALARY. About a third of our respondents
(32%) worked for 2- to 100-person companies. Their median
salary was $65K, which is $15K lower
than our overall median. As companies
grow, so do salaries: the median was
$78K for companies with 101–1,000
employees, $91K for 1,001–10,000
employees, and a generous $103K for
organizations with more than 10,000
employees.
One-person organizations are an exception.
Their $83K median salary falls
between respondents from 101–1,000
employee firms ($78K) and 1,000–
10,000 employee firms ($91K). The
small size of the one-person organization—a bit over 2%
of respondents—
may be focused on specialized work that
commands higher pay.
Comparing 2017 to last year, we see small and mid-size
company respondents losing salary traction relative to those
working in large companies (1,000+ employees):
One-person firms: $83K, down $13K (-13%)
2–100 employees: $65K, down $13K (-17%)
100–1,000 employees: $78K, down $14K (-15%)
1,001–10,000 employees: $91K, down $4K (-3%)
10,000+ employees: $103K, down $5K (-5%)
When we look at companies by age,
we see a similar trend: the older the
company, the higher the salaries. The majority of companies
don’t make it to their fifth birthdays, which indicates that
those that do are onto something. Older, more experienced companies probably also know that it is expensive to recruit and train new
team members, so offering higher salaries to keep people can be worthwhile
in the long run.
What specific industries do our respondents represent? It’s no surprise
that Software is by far the largest category—36% of the respondents. The
Software industry’s median salary is $73K, $7,000 less than the overall
survey average. Aside from Consulting, which has a median salary of $72K,
Software is actually the category with the lowest median salary.
All the other industry segments had fewer respondents than Software,
and showed higher median incomes, with the exception of Consulting.
The results may show some selection bias: those working in the Software
vertical likely have a wide range of experience levels working on similar
types of tasks while also showing the widest range of salaries of any
vertical ($36K to $119K). Those in other verticals (perhaps doing more
specialized programming requiring more experience and/or education) can
demand higher salaries.
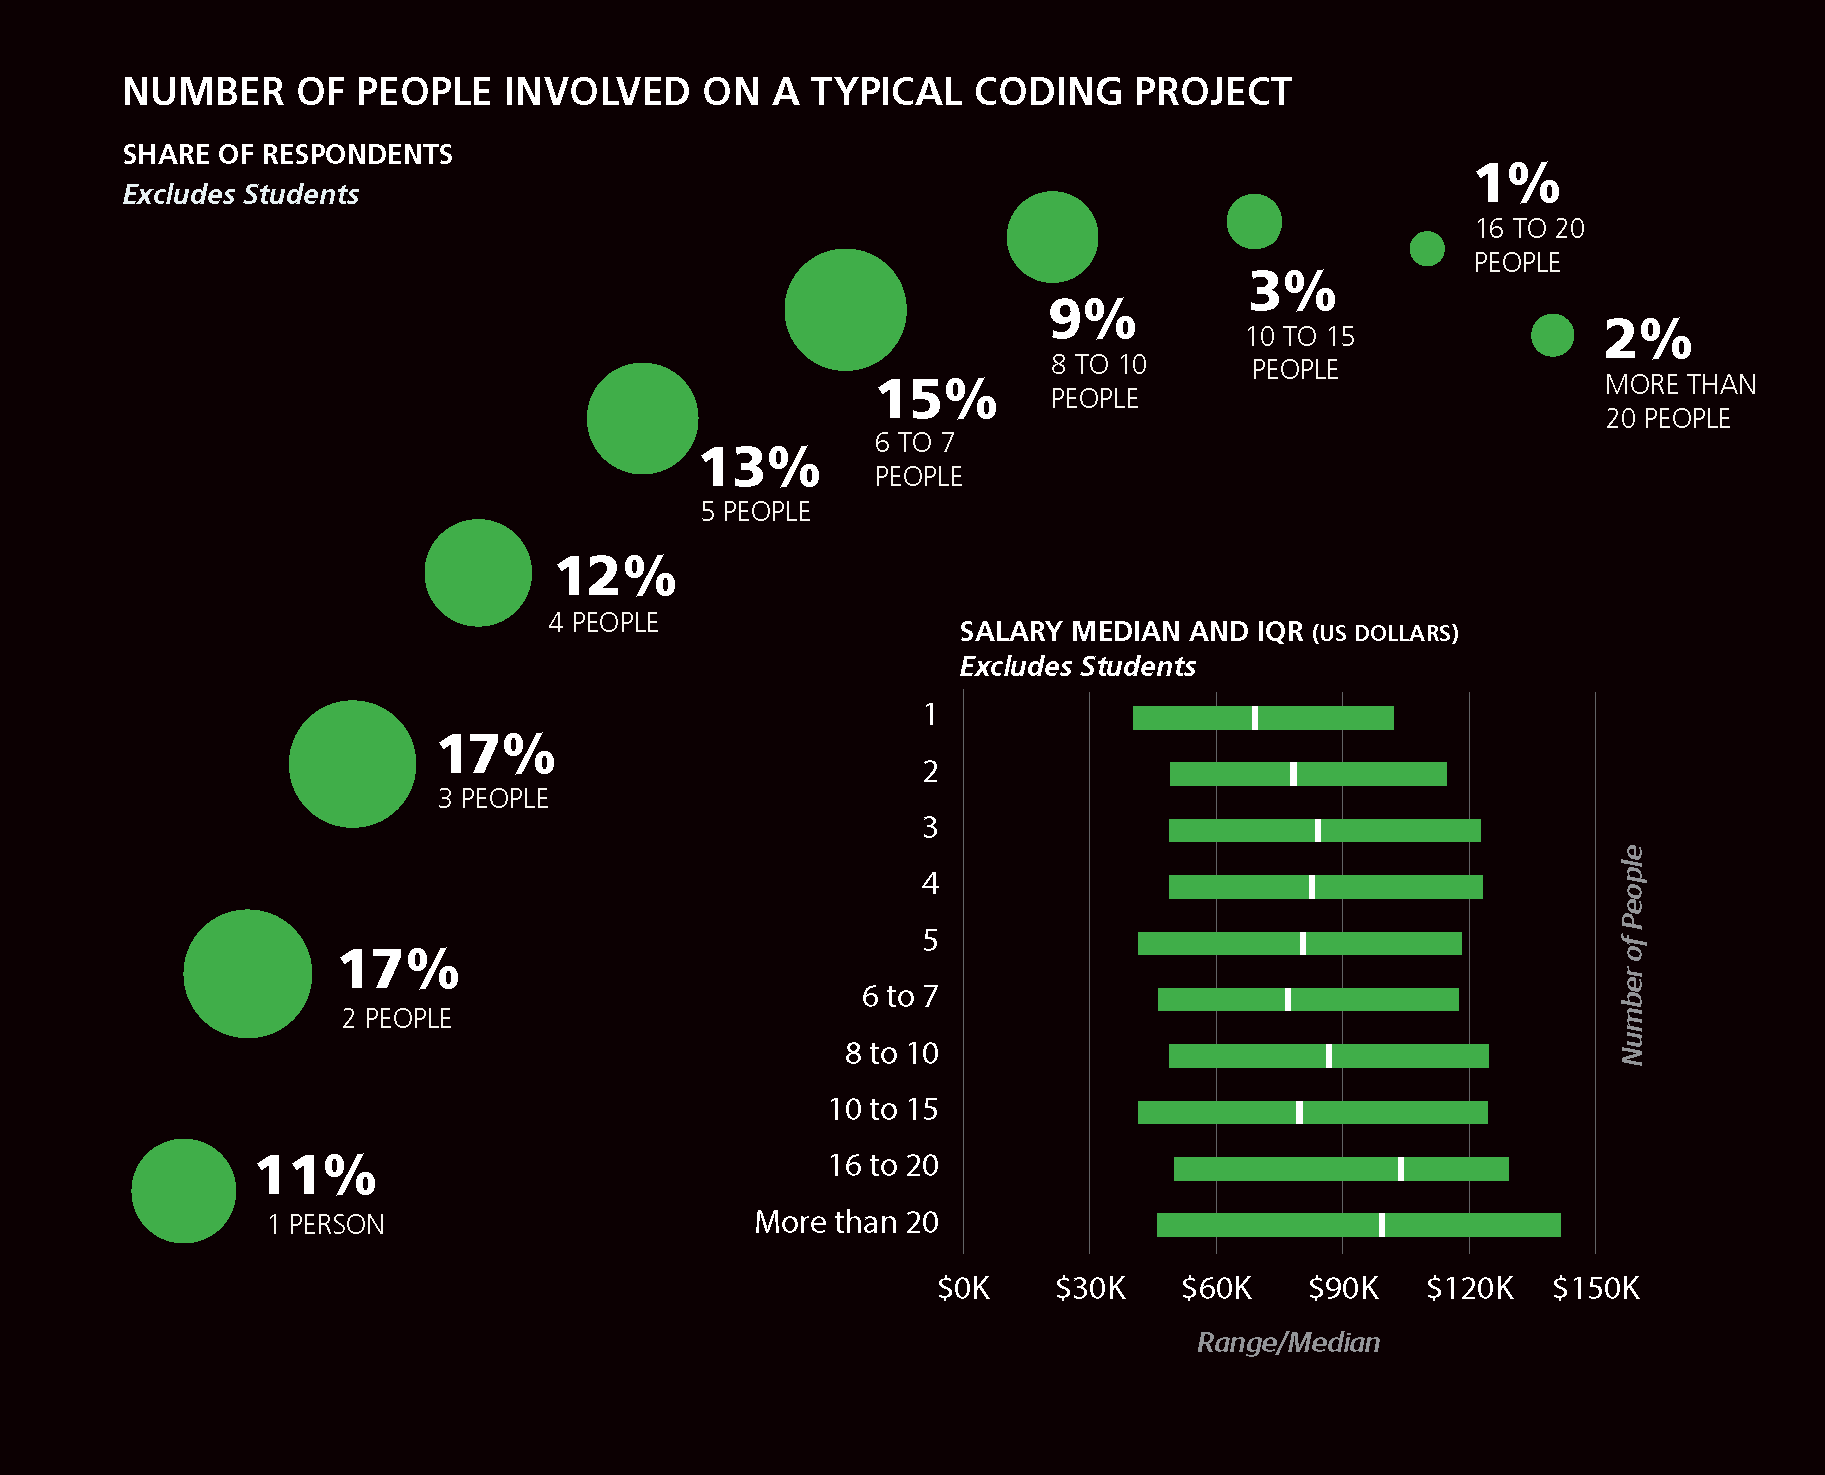
Team Size
TEAM SIZE IS AN IMPORTANT FACTOR IN COMPENSATION.
Generally, people on larger teams make higher salaries. One-person
teams make around $69K median salary, whereas folks on 20+-person
teams have a $99K median salary. This could simply be explained
by the fact that, in order to have a large team, you need a larger
company and, as we’ve seen, the larger the company, the higher the
median salary.
However, team sizes of one don’t necessarily mean small companies.
One-person and small teams could simply mean that these
respondents are on small teams (or work by themselves) inside
large companies that don’t have many programmers or are not in
the Software industry.
It seems that it is better to work with more people, at least in terms
of salaries. As they say, a high tide raises all ships.
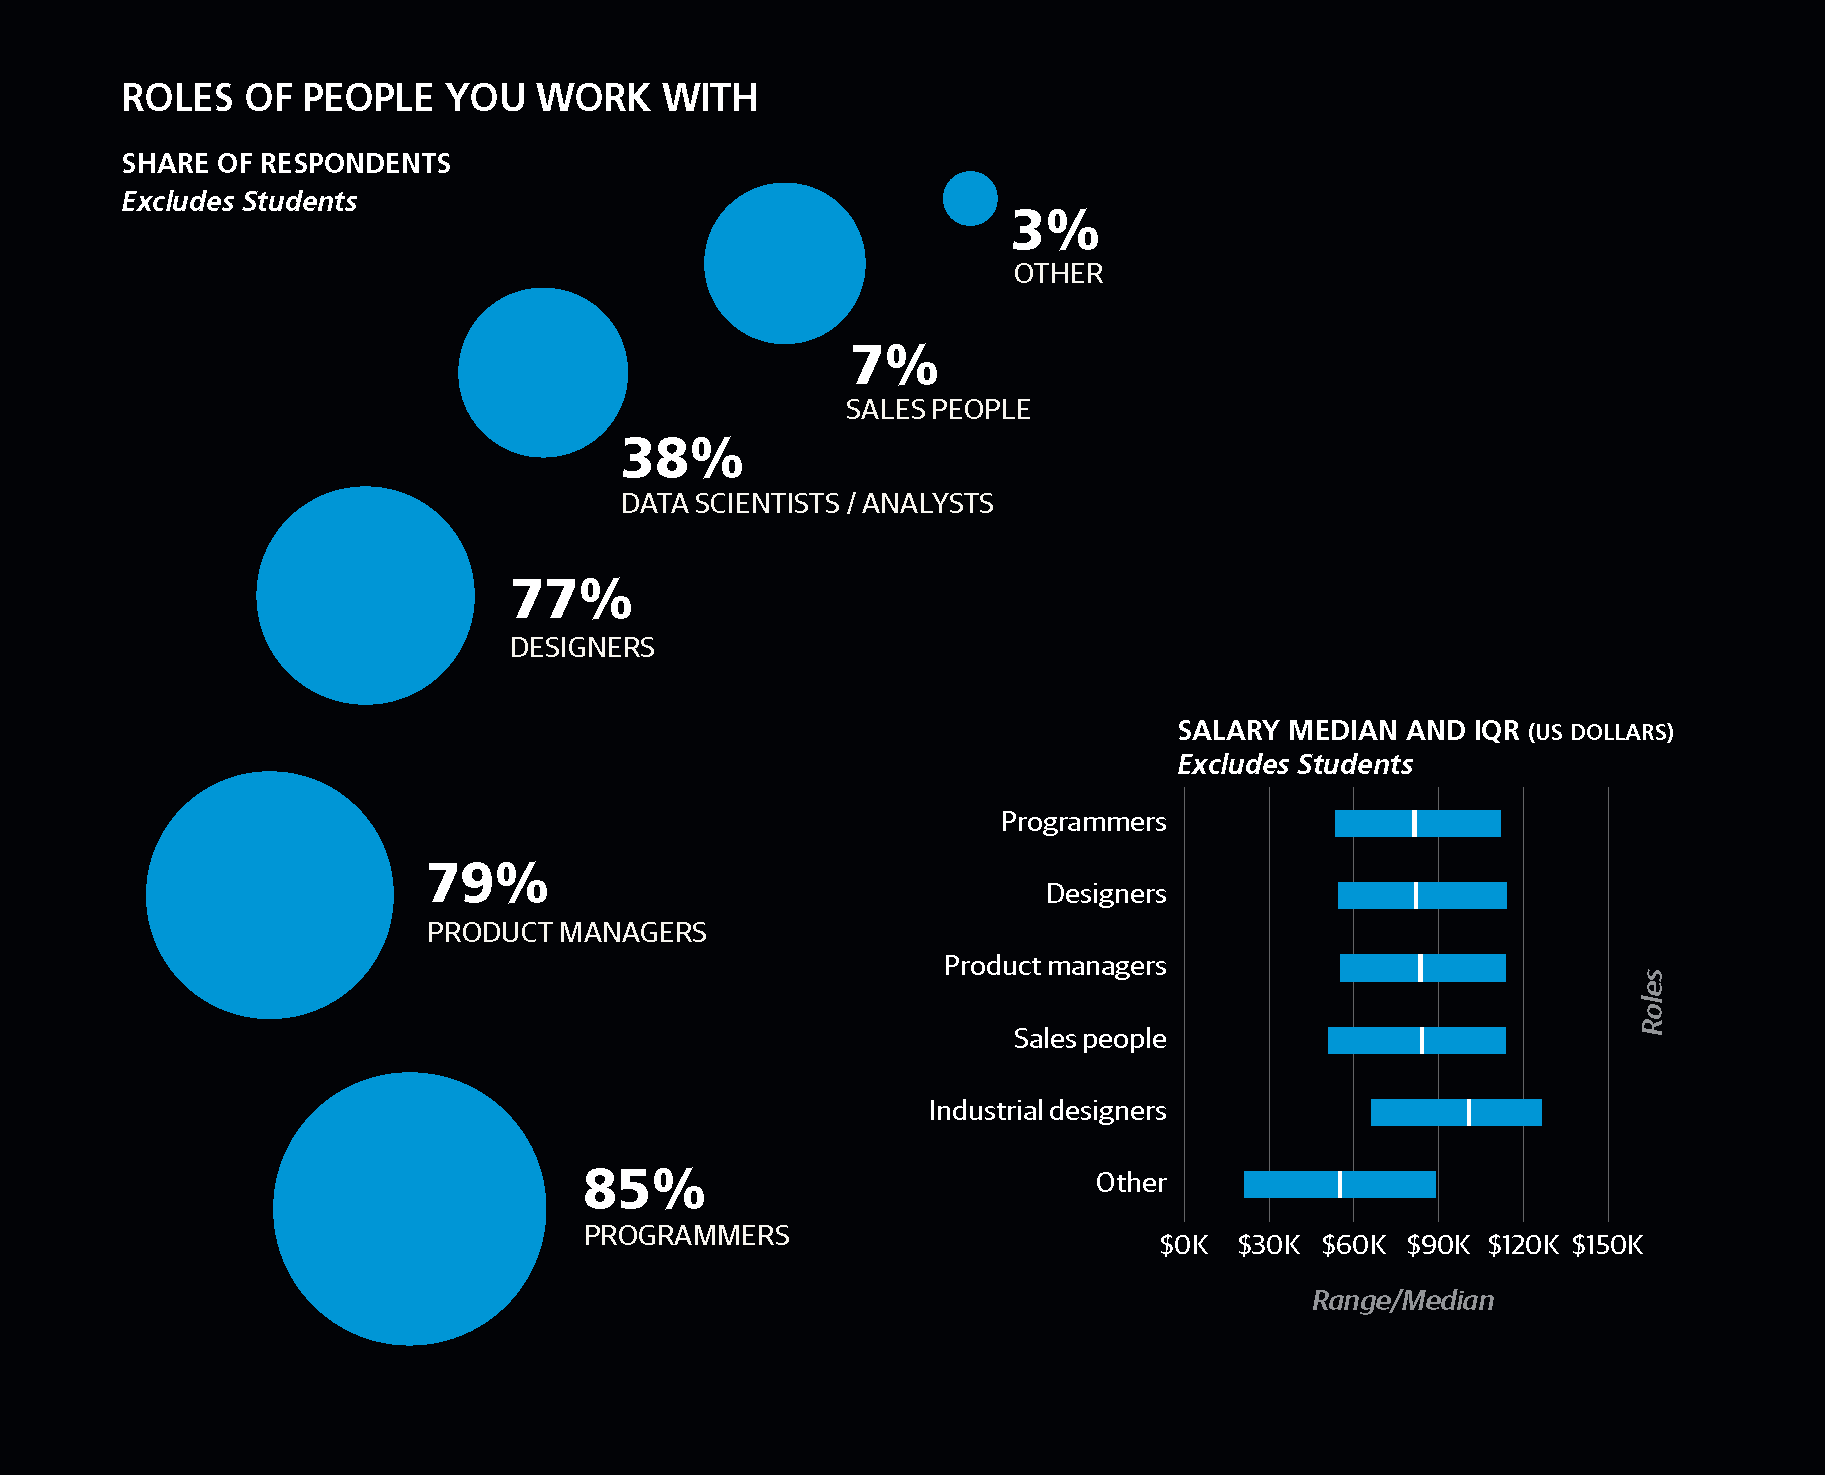
Collaboration
88% OF THE RESPONDENTS SAID THEY
COLLABORATE WITH PROGRAMMERS. According to our
results, who you collaborate with doesn’t have much impact on
your salary: when we look at the median salaries broken down by
collaborator, we find that they are between $80K to $94K, with
the exception of “None of the Above.”
Who you collaborate with doesn’t impact your salary, but not
collaborating certainly hinders it. The 3% of respondents who
worked solo and didn’t collaborate with people in any of the roles
we listed in our survey (designers, programmers, data scientists/
analysts, product managers, and salespeople) earned a median
salary of only $56K.
Individual Background
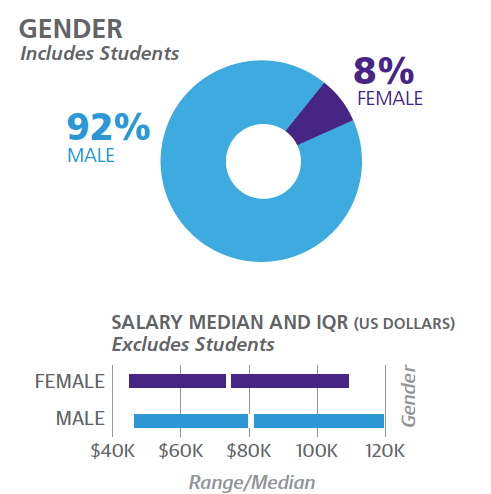
Gender
We had over 425 female respondents—a large enough cohort
to likely provide representative results. They represented 8%
of survey participants.
As we’ve noted, all salaries are down in 2017; however,
women increased their relative salaries compared to the male
respondents, from 86% to 92.5% of what their male counterparts
earn. In the 2016 survey, women earned around $80K
on average, whereas their male counterparts earned $93K.
This year, women’s median salaries dropped to an average of
$74K and men’s to $80K.
There also appears to be an uptick in new women into the industry:
over a third of the female respondents have less than
5 years’ experience, as compared to about 17% of men.
Unfortunately, female respondents still trail men when it
comes to their roles. There were no VP/Director or C-level
women reporting in the survey. The majority of women, 65%,
described themselves as software developer/engineer. (That’s
8% higher than their male counterparts.)
If the trend keeps up and more women continue to enter the
software industry, it will begin to redress the lopsided gender ratio. And as women move up the ranks, join larger companies,
and gain more experience, hopefully their salaries will
increase and close the pay gap.
Age
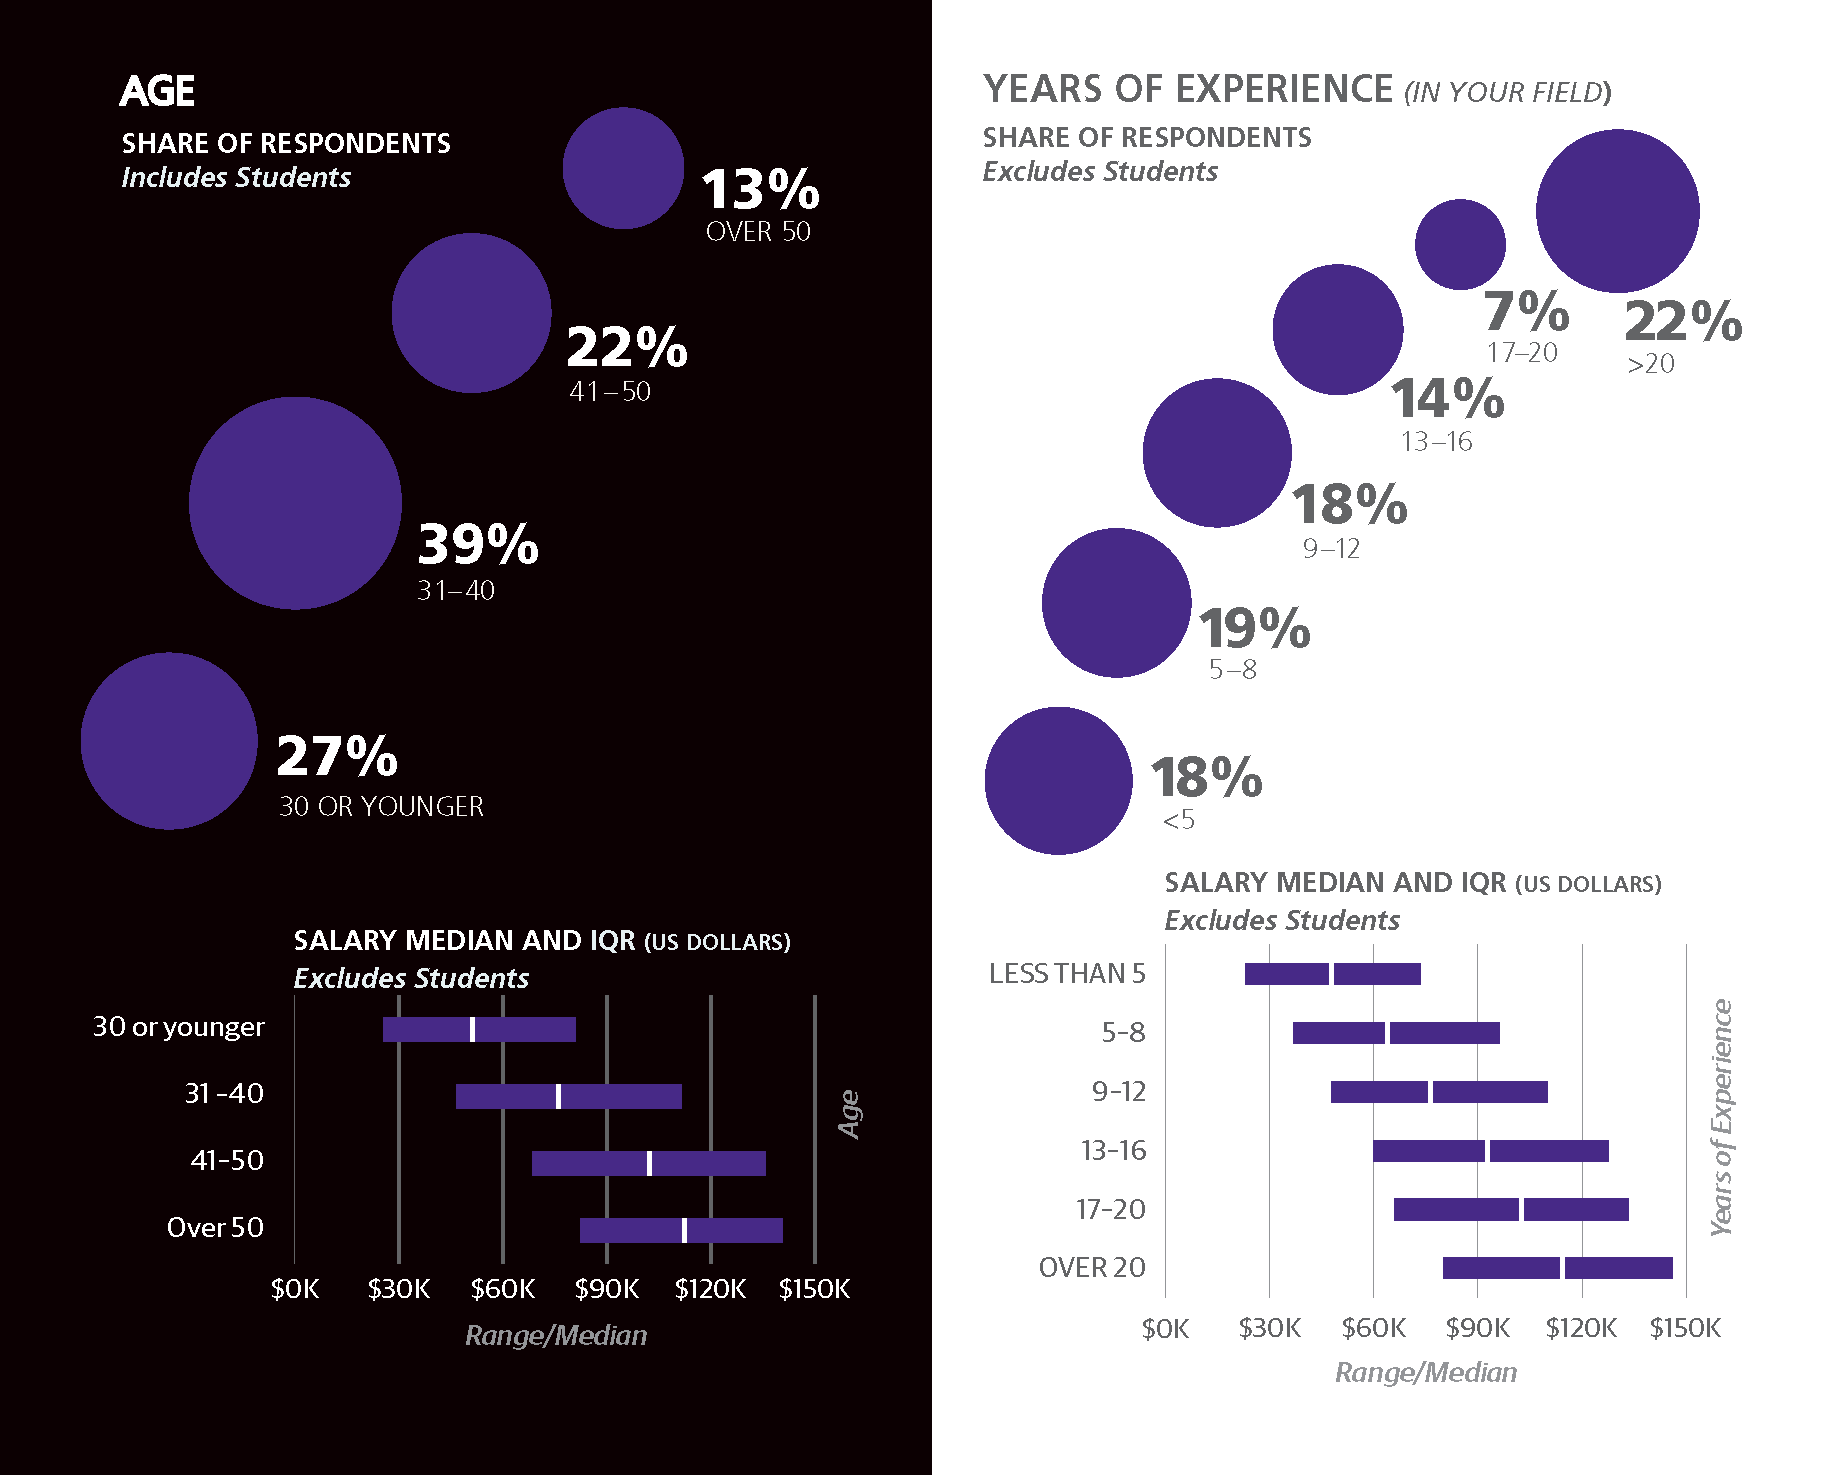
The age of the respondents skews youngish, with two thirds
of respondents 40 or younger, 22% in the 41–50 range, and
only 13% older than 50.
It seems that salaries increase with age and experience.
The over 50s were the only group to increase their salaries
compared to 2016. While the over-50 group increased $2K,
the 41–50 group lost around $5K in salary. The 31–40 group
dropped from $90K to $76K, and the 30-and-younger group
dropped from $64K to $51K.
Years of Experience
Across the board, the more experience you have, the higher
the salary. On average, every year you work, you get a
$4.4K pay raise.
Respondents with less than 5 years’ experience had a median
salary of $48K. At the other end of the spectrum, those with
20+ years’ experience had a median salary of $114K.
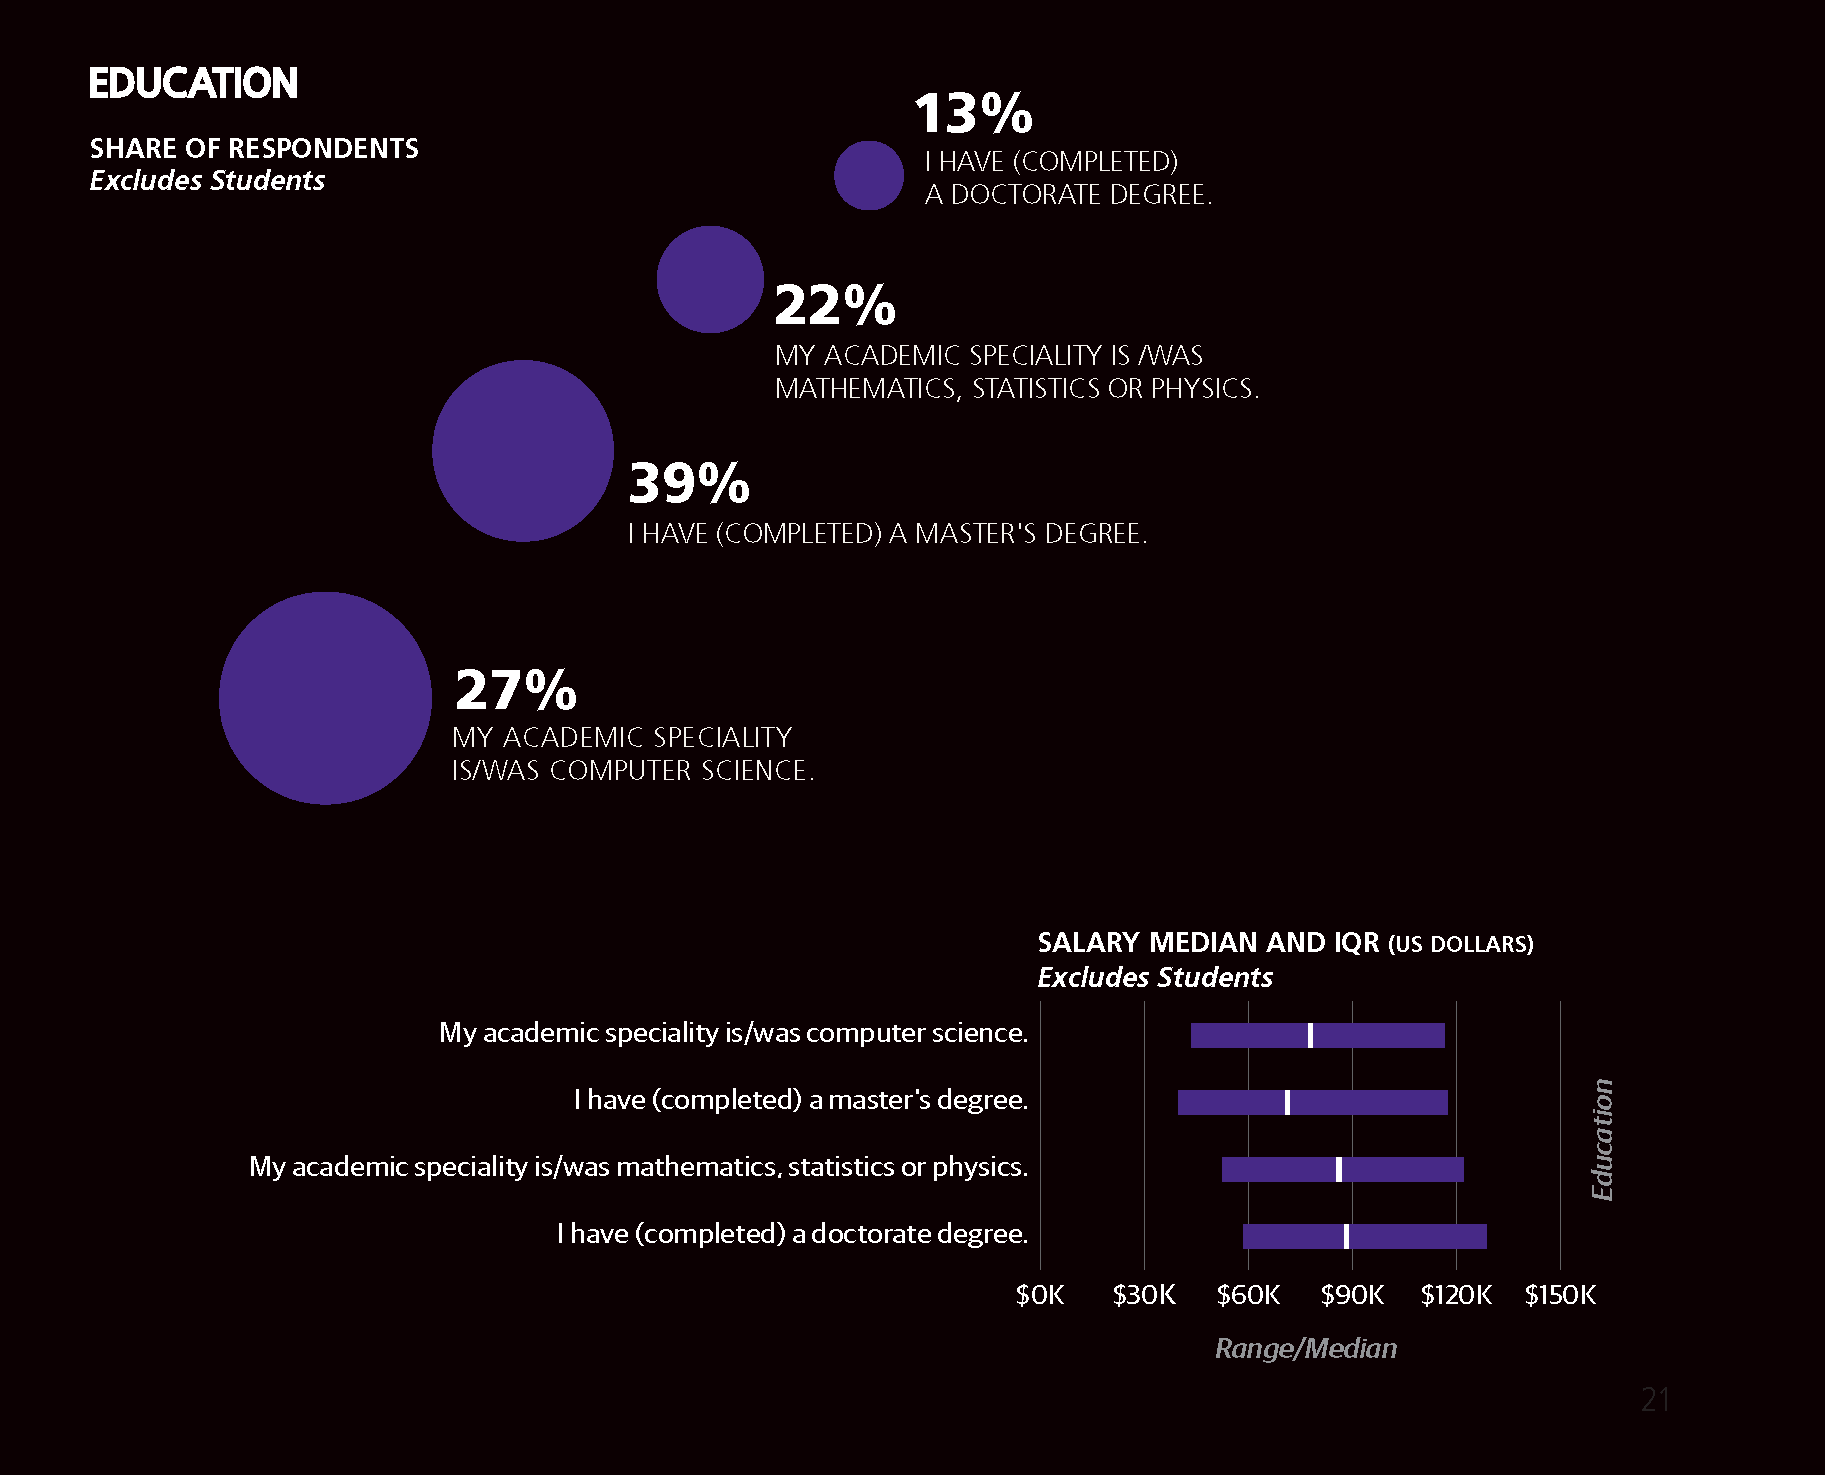
Education
A bit more than half of our respondents list computer science
as their main degree, about the same as last year. 40% of
participants have a master’s and about 6% have a PhD. This
extra education appears to pay off: compared to those whose
education stopped at the Baccalaureate level, respondents
with master’s make about 18% higher salaries; for PhDs, the
figure is 45% higher.
While this is an impressive increase ($17K+ higher in salary for
a PhD versus a master’s degree), is the extra time and expense
of getting a PhD worth it? That depends on the type of work
you’d most likely engage in. Folks with advanced degrees likely
work on more specialized, cutting-edge challenges. These
jobs are usually in high demand and therefore offer higher
pay, which helps offset student loans.
Title, Roles, and Tasks
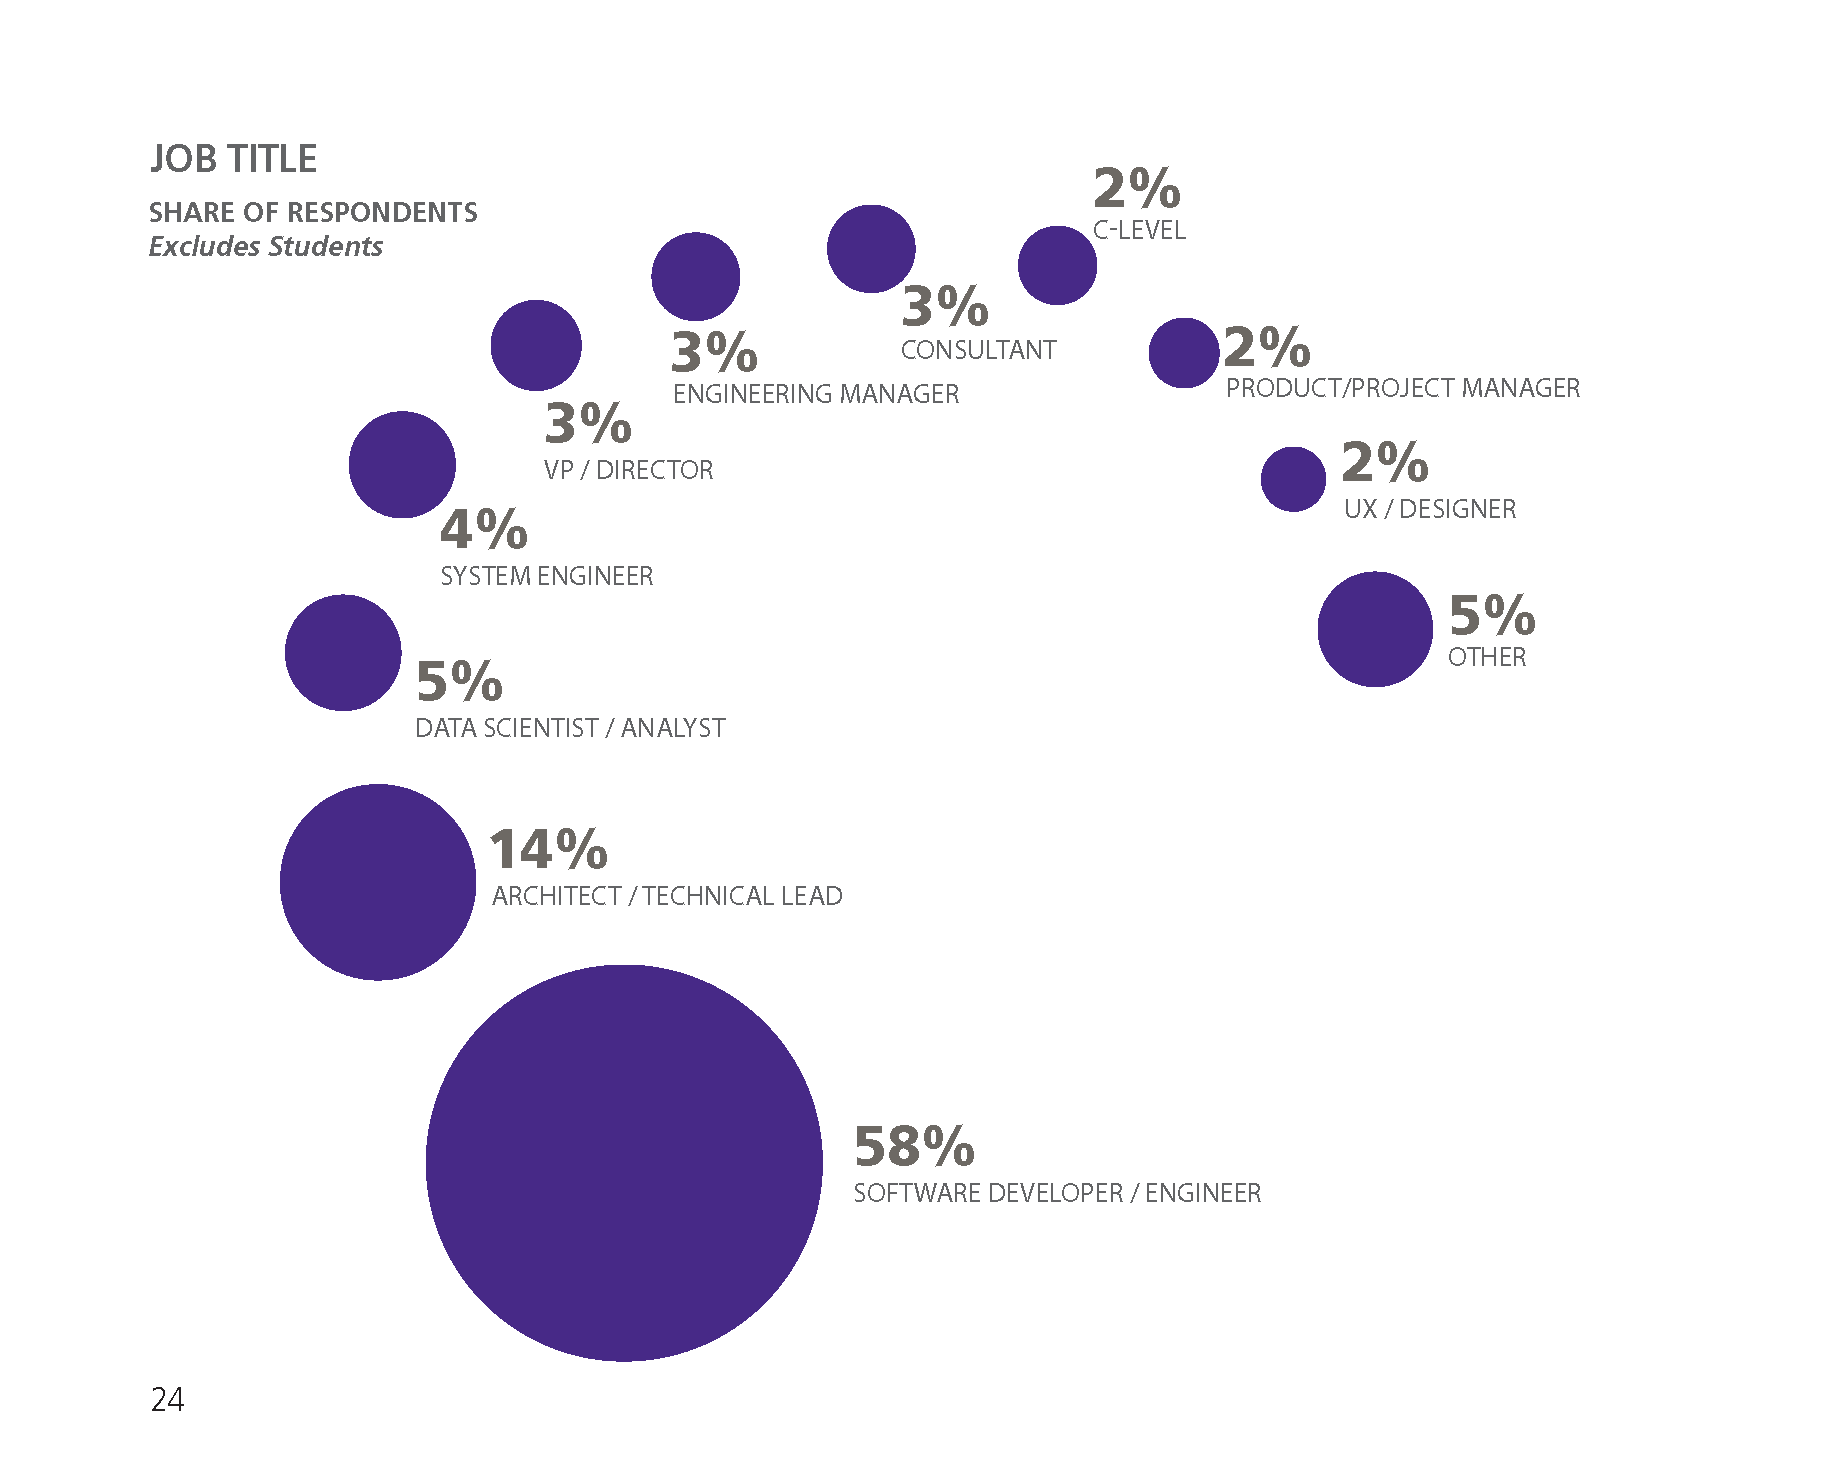
58% OF RESPONDENTS classified themselves as software
developers or software engineers; their median salary is
around $71K. When salaries are ranked by role, data scientist/
analyst is at the bottom:
$84K Consultant (3% of respondents)
$75K UX/Design (2% of respondents)
$72K Other (5% of respondents)
$71K Software engineer (58% of respondents)
$70K Data scientist/analyst (5% of respondents)
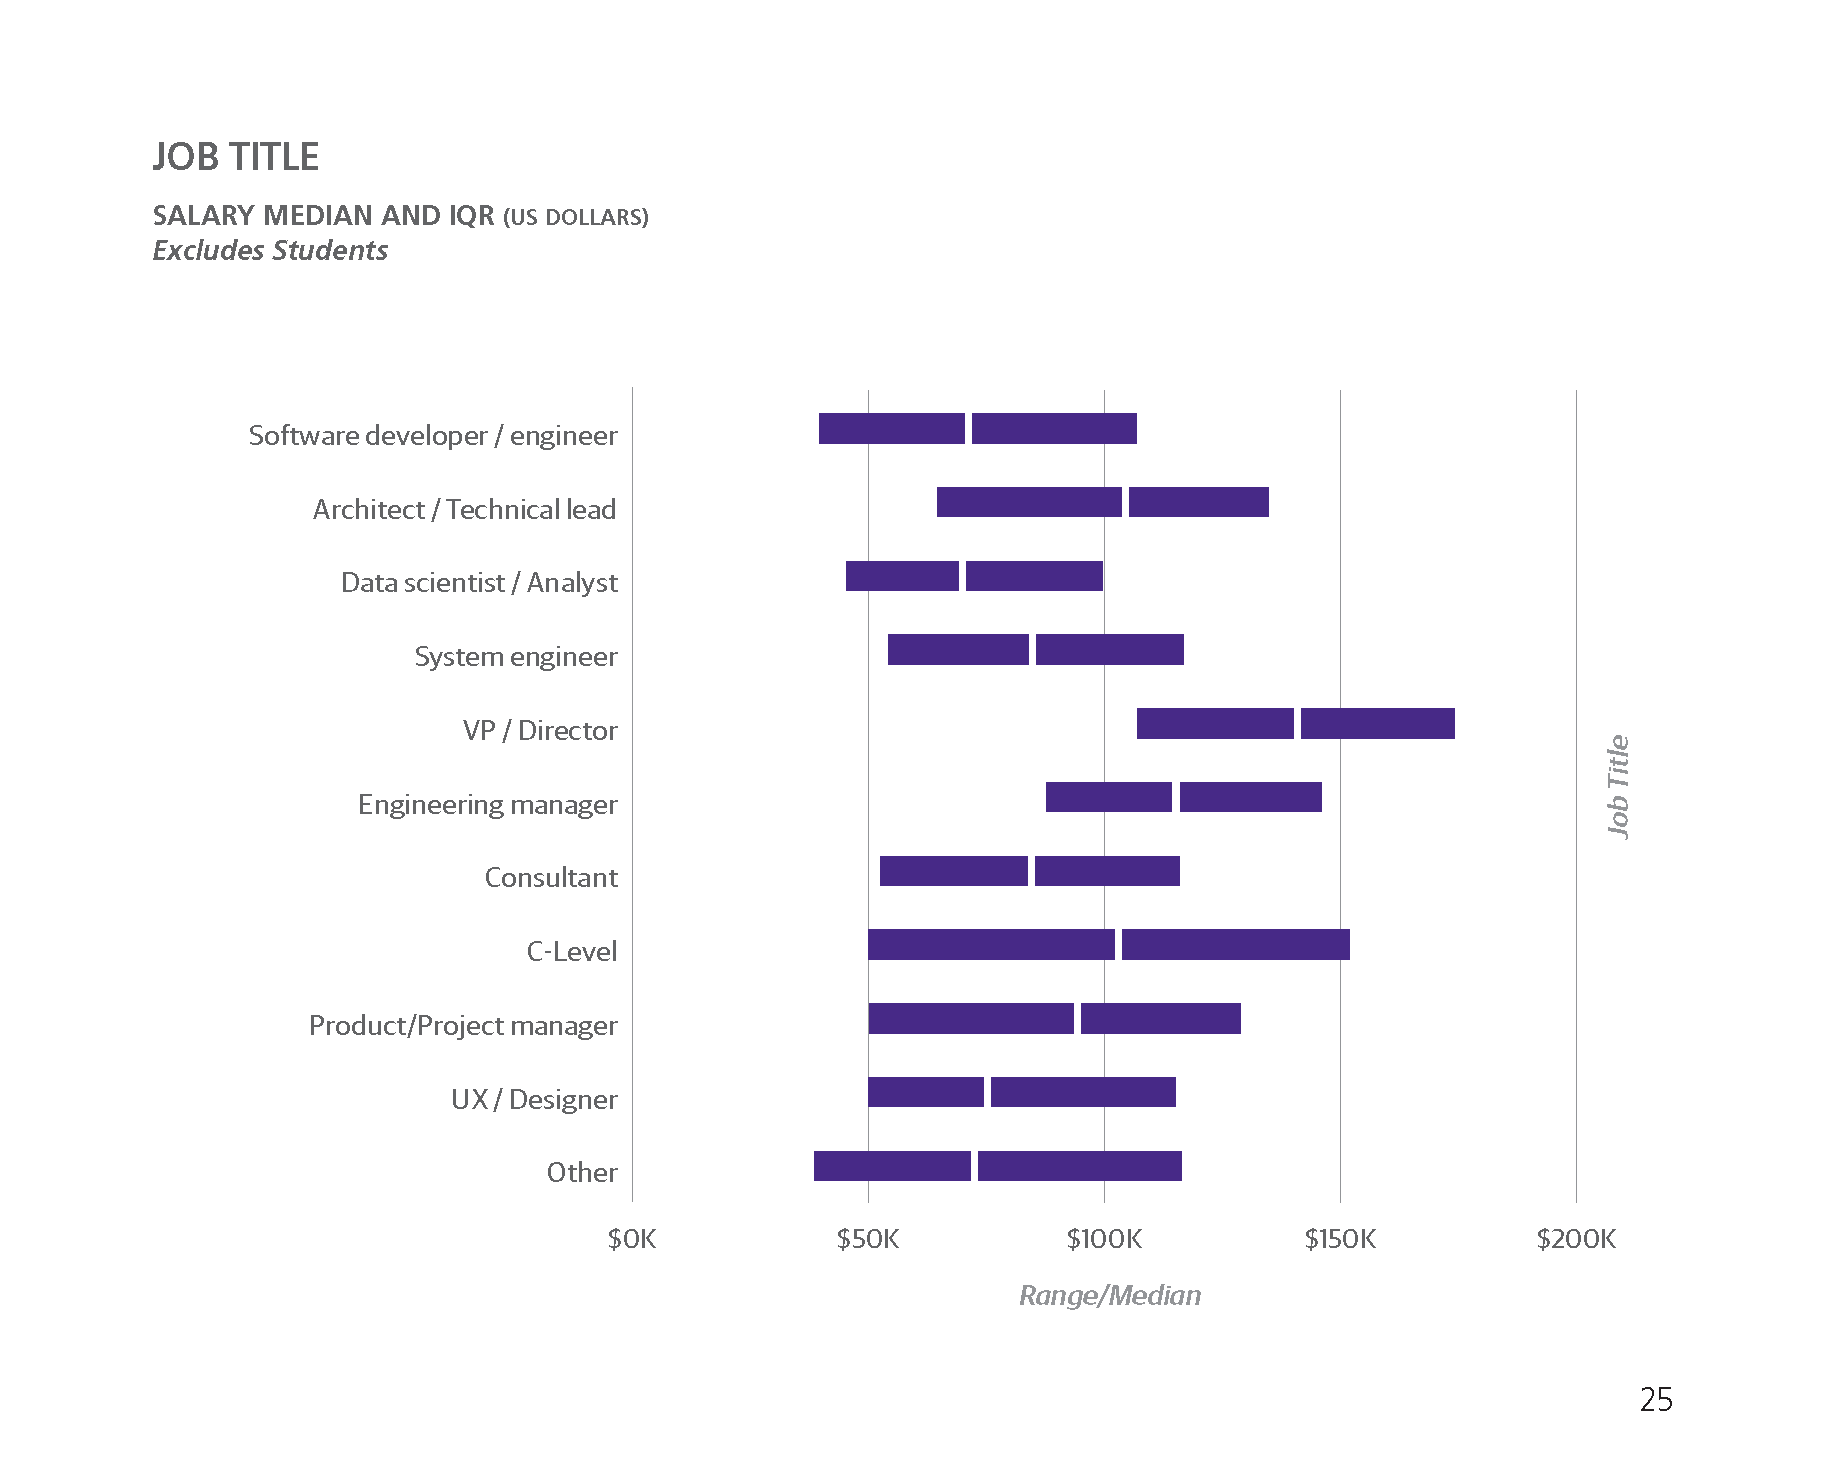
It seems strange that people in Consultant and UX/Design
roles make more than software developers/engineers. This
is probably due to the small number of respondents in these
roles. Given more respondents, there would be a broader spectrum of possible salaries, and more companies and tasks
represented, which would give us a better picture of the real
salary levels.
As we move up the hierarchy, those with C-level titles (CTO,
CIO, etc.) are paid a median
salary of $102K, architect/technical
leads make around $104K,
and VPs/directors earn around
$140K.
Software engineer/developer
was the role the largest percentage
of students identified
as. Their median salary was
$35K, half what their non-student
counterparts are paid. Not
surprisingly, there were no VP or C-level respondents in the
student group, and only 6% listed themselves a technical lead
(compared to 14% of non-students).
Note
It seems strange that people
in Consultant and UX/Design
roles make more than
software developers/engineers.
Meetings
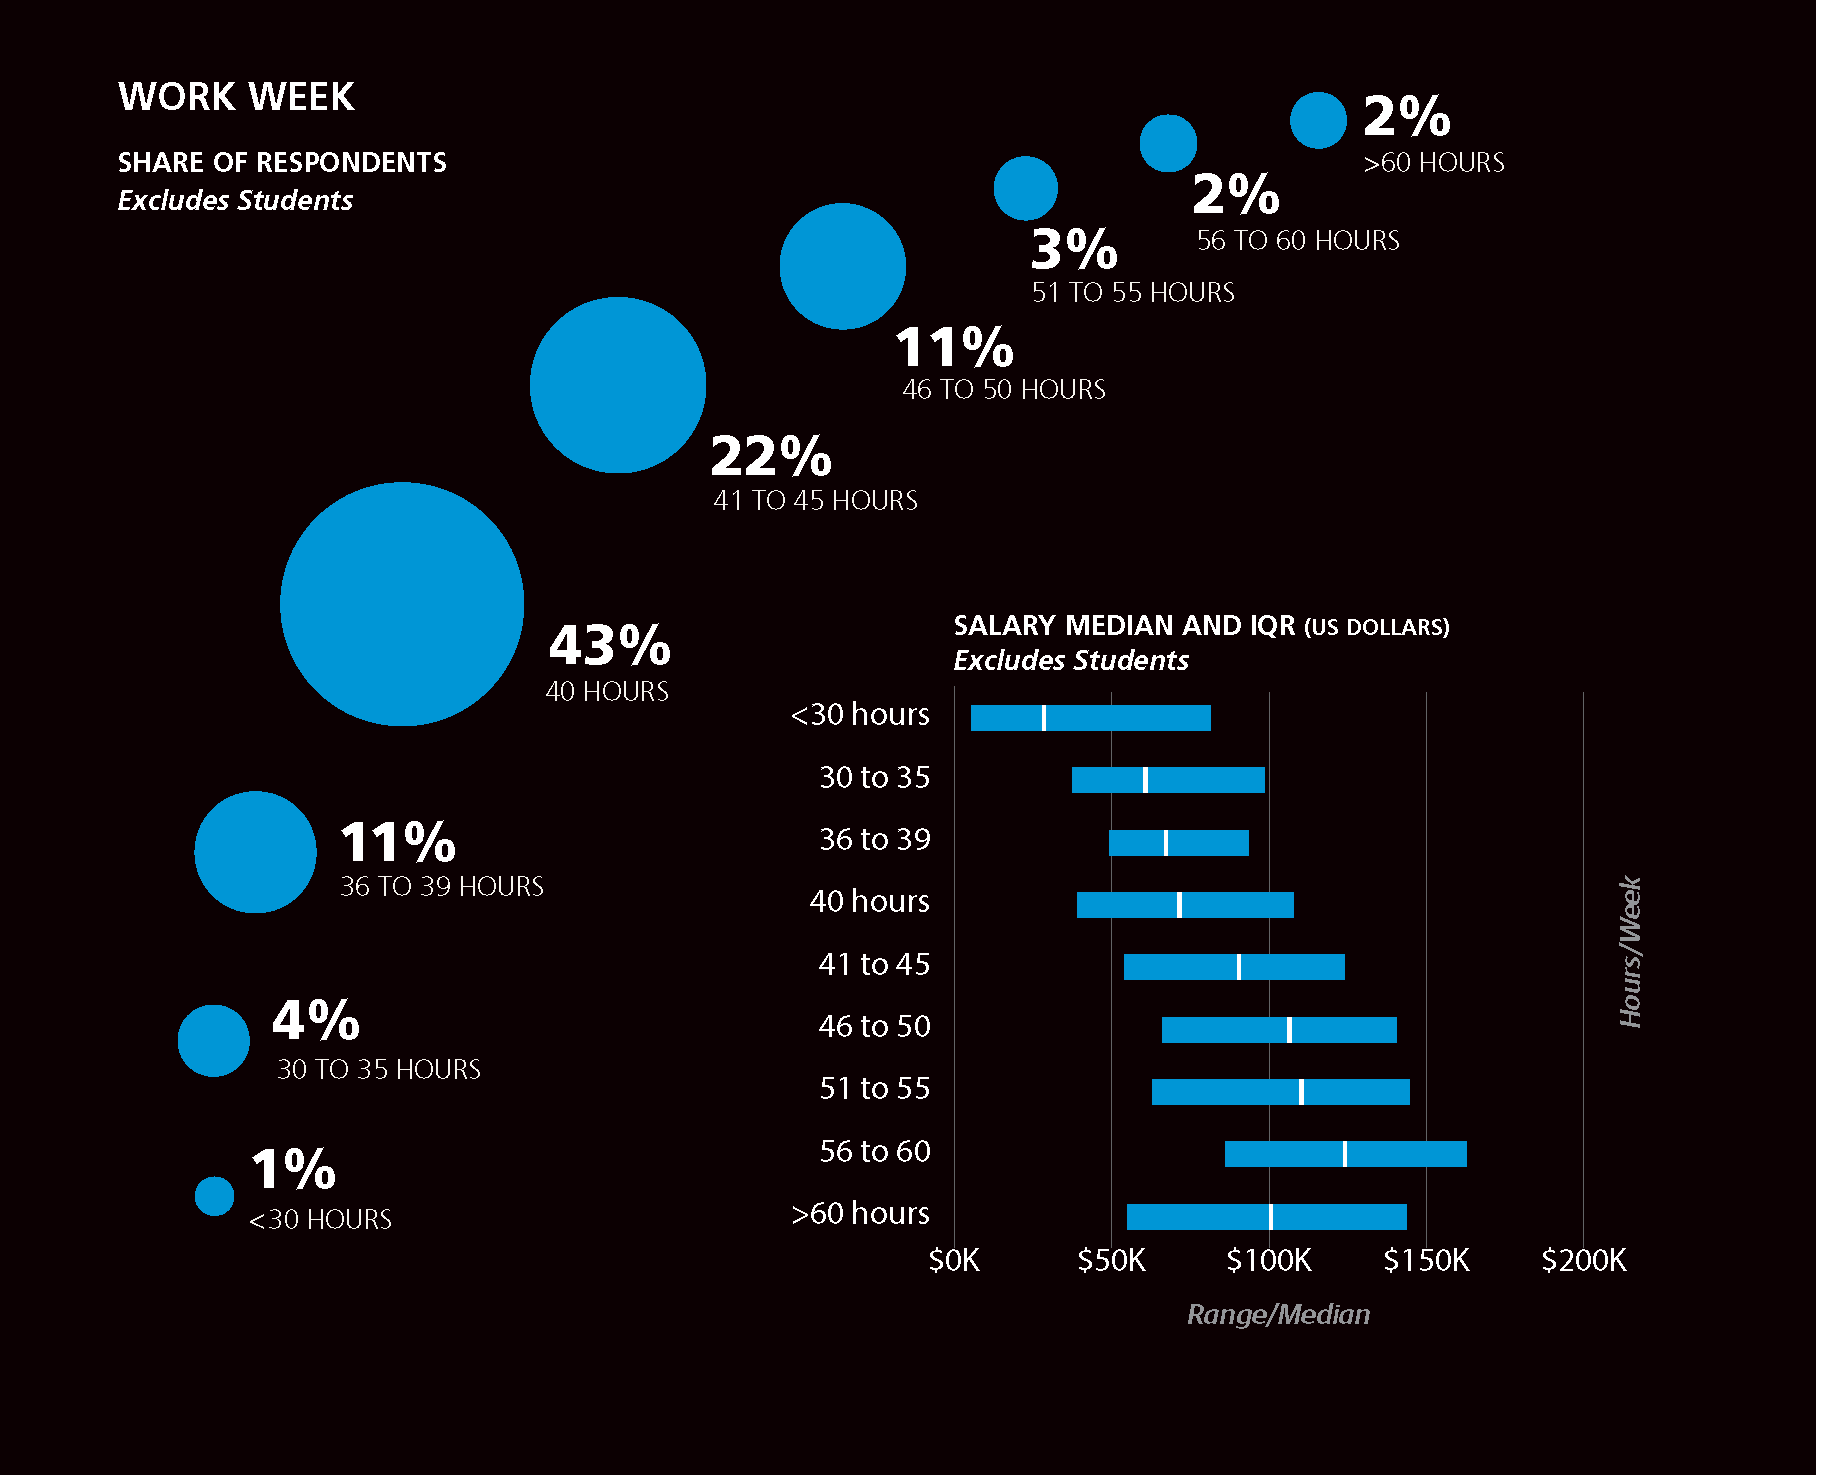
A lucky 3% of respondents don’t attend meetings, whereas
the largest share of respondents (43%) attend 4–8 hours
of meetings a week. This may
seem like a lot, but if they are
using the Agile methodology,
they probably have a 15- to
30-minute stand-up each day.
Four days of that adds up to 2
hours a week; throw in a 1-hour
planning meeting or retrospective
and you’re getting close to
4 hours.
An unlucky 3.5% of respondents
spend more than half their
work week—20 or more hours—in meetings.
Somewhat counterintuitively, the more time you spend in
meetings (and presumably not actually producing output), the
higher your salary. This doesn’t mean you should go and book yourself into every optional meeting you can; there is probably
an underlying factor, such as responsibility level, which affects
both salary and time spent in
meetings. For example, C-level
respondents are likely to spend
a lot of time in meetings, working
long hours, and making
difficult decisions, and they are
compensated accordingly. So it
isn’t necessarily the hours spent
in meetings that affect the
salary, but probably the level of
responsibility that determines
the number of meetings.
The findings regarding meetings aligns with what we’ve
found in all O’Reilly salary surveys to date: time spent in meetings
serves as a reliable proxy for the increased responsibility
that comes with the type of leadership, planning, and management
roles associated with higher salaries.
Note
Somewhat counterintuitively,
the more time you spend in
meetings (and presumably
not actually producing output),
the higher your salary.
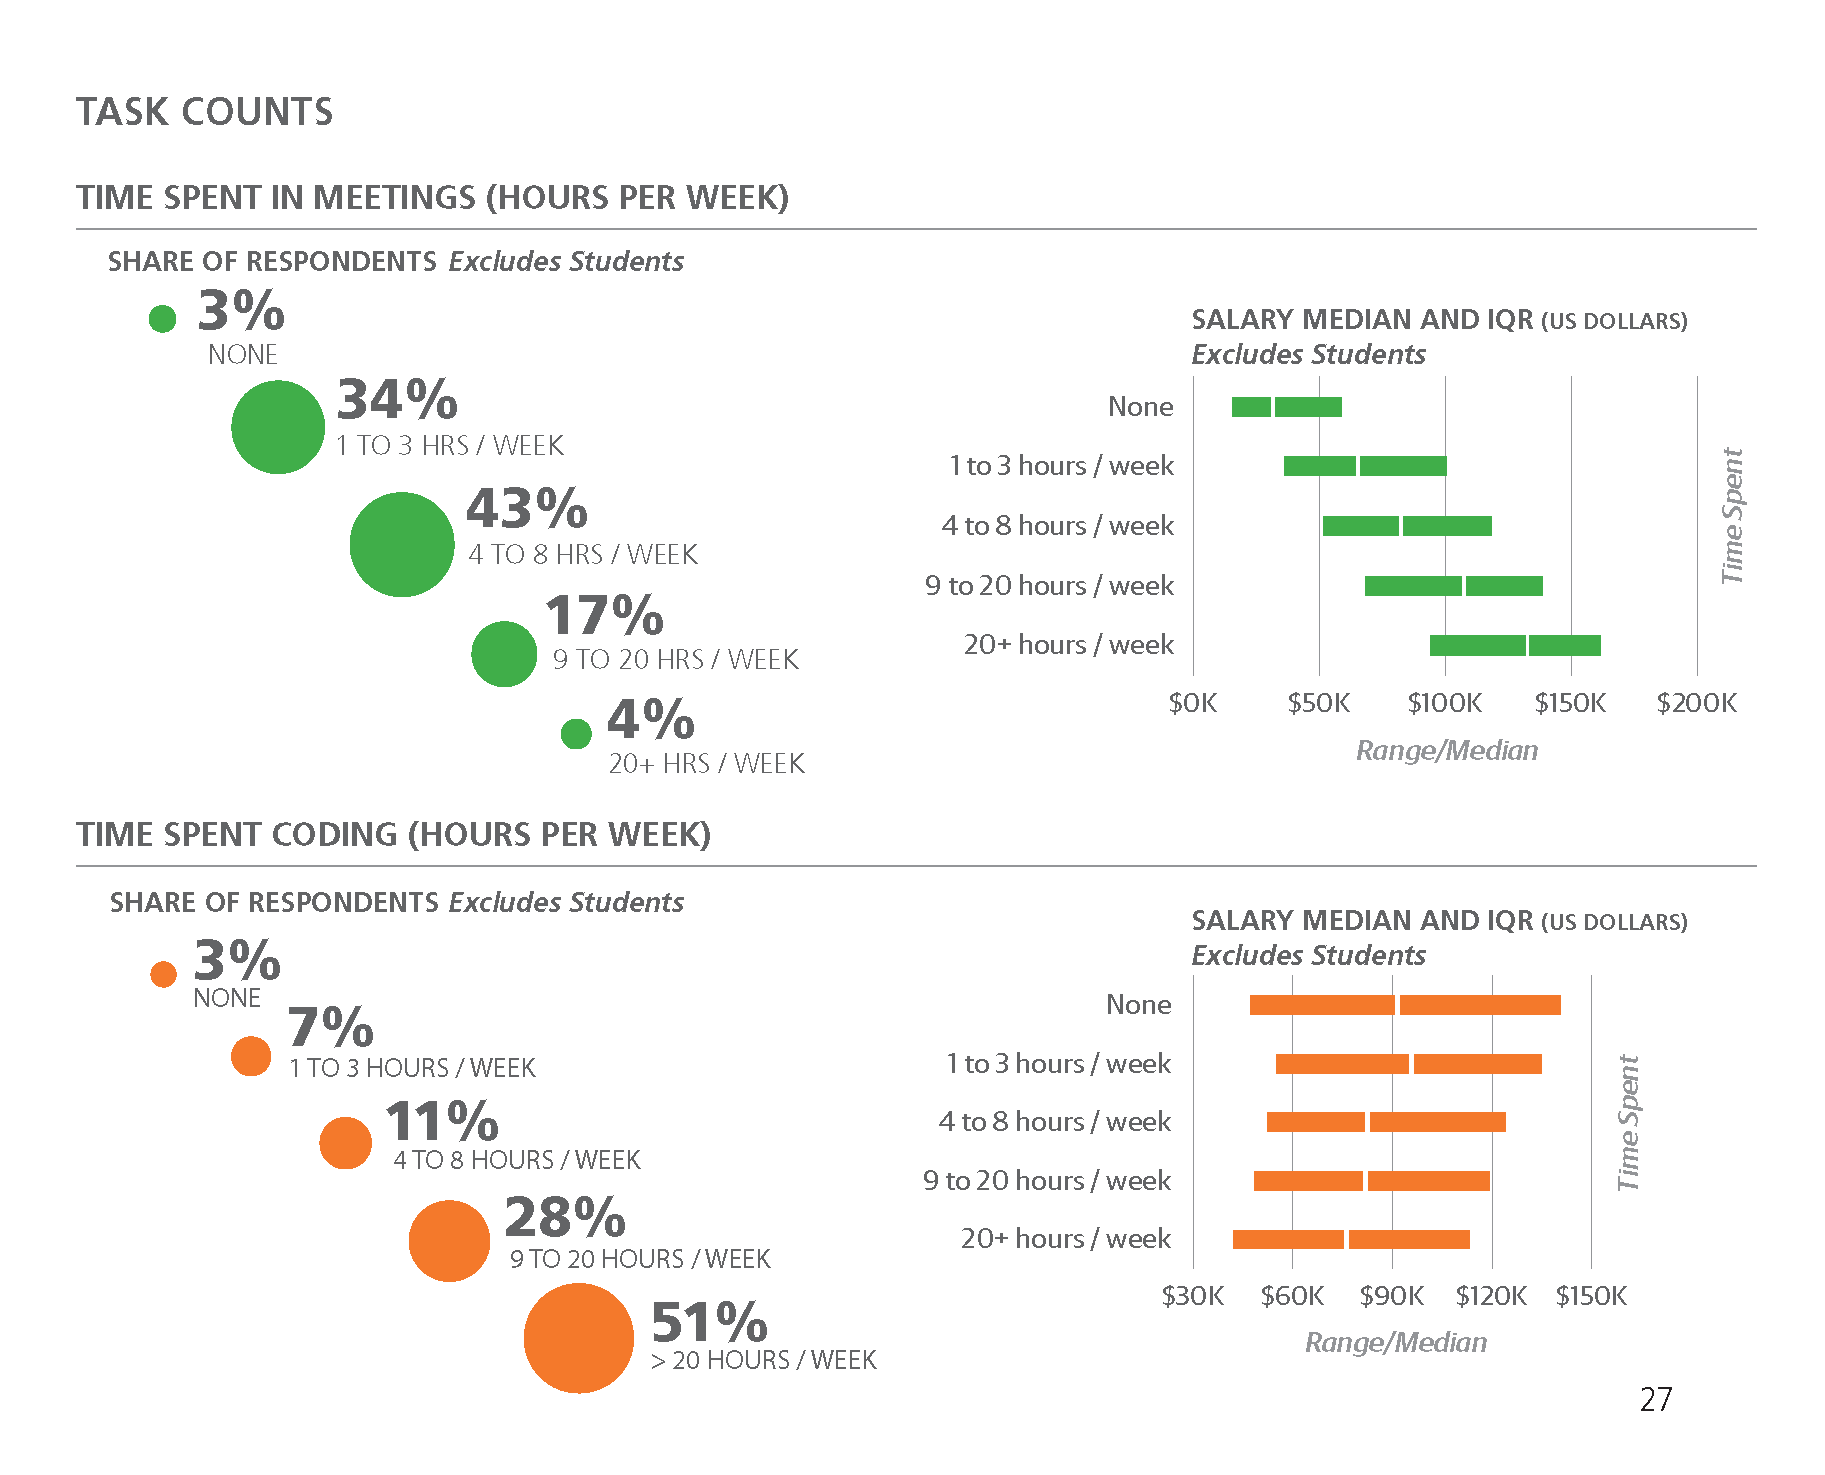
Coding
The survey data shows that more hours spent per week coding
correlates with lower salaries. Similar to what we find with
meetings, junior coders and those in less-responsible positions
(and positions with fewer non-programming duties) spend
more time programming than those who don’t.
This trend applies to students and non-students alike: more
time coding means lower salary.
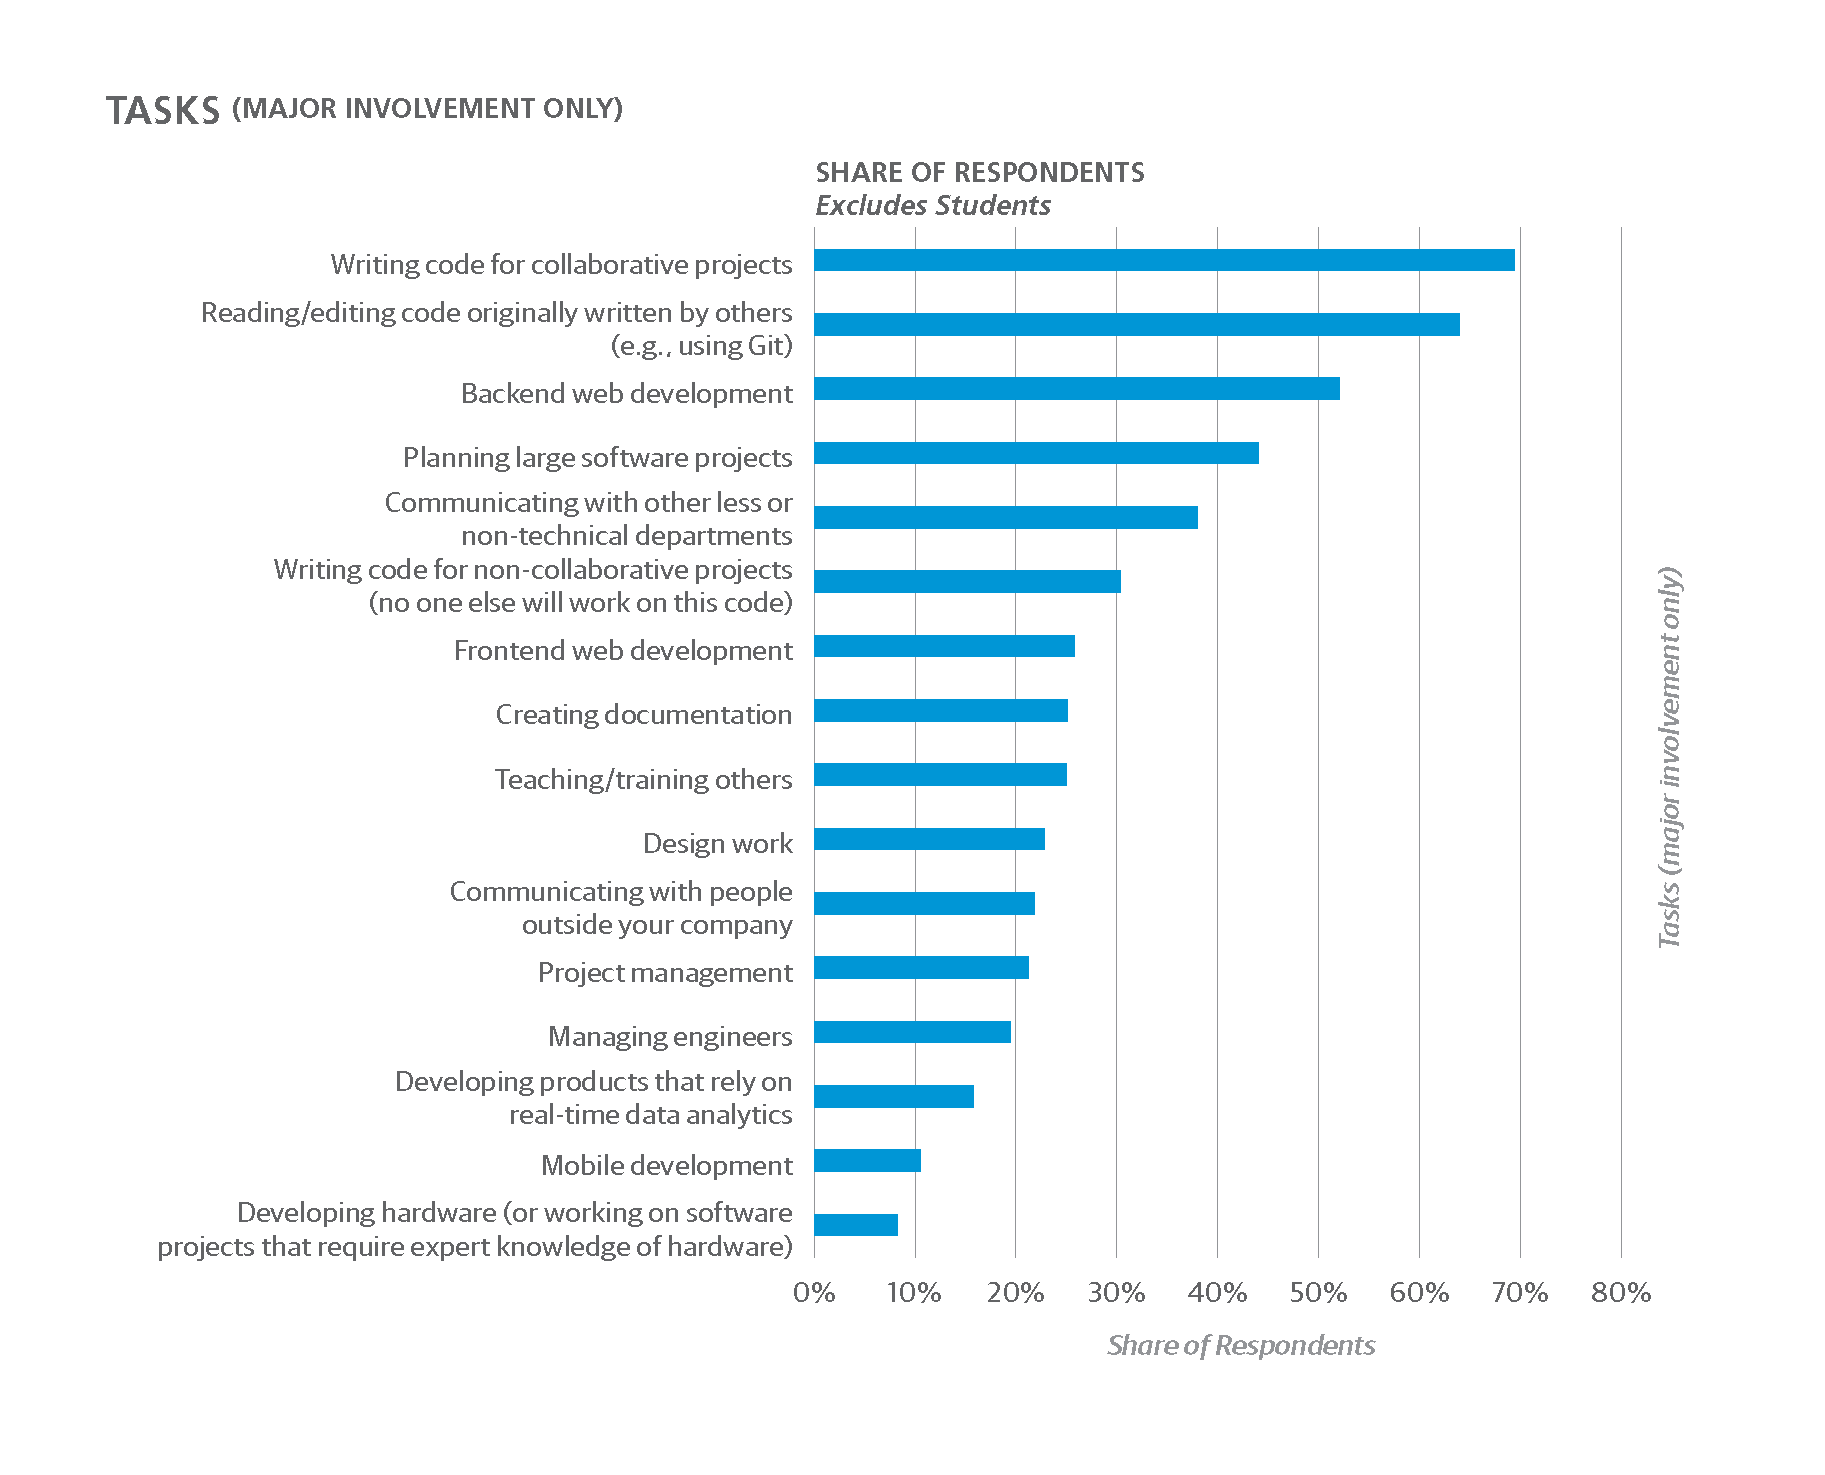
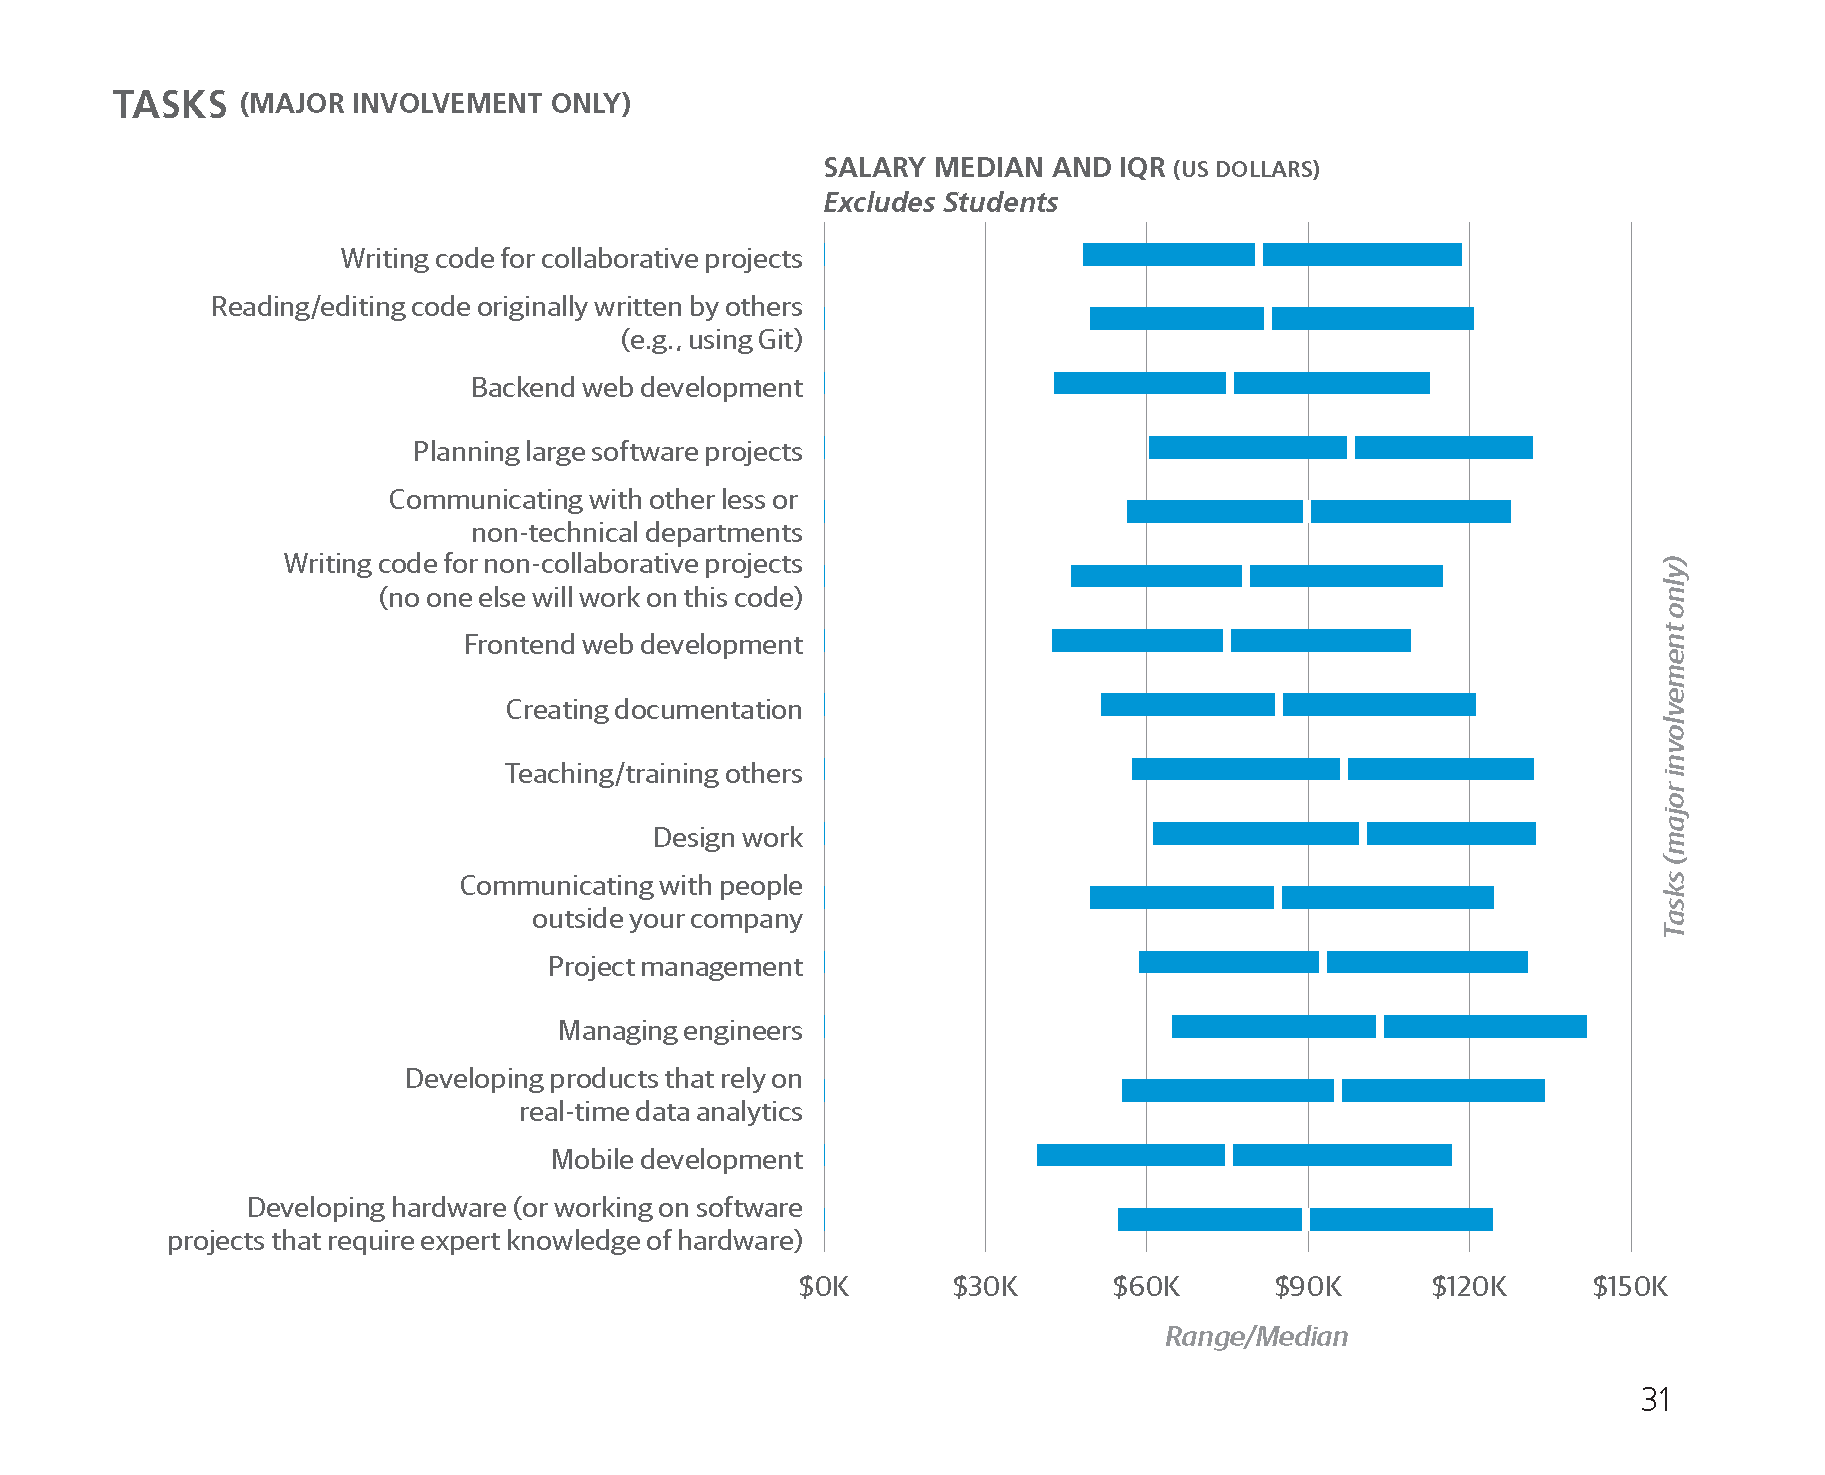
Tasks
The type of tasks you perform
can have a big impact
on your salary. Depending
on your tasks, you might
make a whopping $130K
or more a year. “Developing
products that rely on
real-time data analytics” is
the highest paid task that is
independent of seniority. The
16% of respondents who listed this task among their duties
earn a median salary of around $96K and the top 25% of
those respondents had salaries greater than $134K.
As mentioned earlier, the vast majority of respondents are
software developers/engineers, so it’s no surprise that 69% of respondents say they “Write code for collaborative projects.”
This garners a median salary of around $81K, slightly
more than the overall median salary (excluding students). For
comparison, writing code for collaborative projects earned a
student a $41K median salary.
When we look at all the other tasks noted, there are a few standouts.
Design work is performed by around 23% of the respondents;
their median salary was
$100K. 12% of students said
they engage in design work;
their median salary was $60K,
one of the highest salaries by
task type for students. This
could show that companies
are willing to pay more for
multi-talented people who can
code, design, and handle other
responsibilities.
Planning large projects, performing
project management, and managing engineers were
tasks listed by respondents who earned some of the highest
salaries. These tasks are associated with more senior-level
positions with more responsibilities, so the increased salaries
make sense.
Note
Planning large projects, performing
project management, and managing
engineers were tasks listed
by respondents who earned some
of the highest salaries.
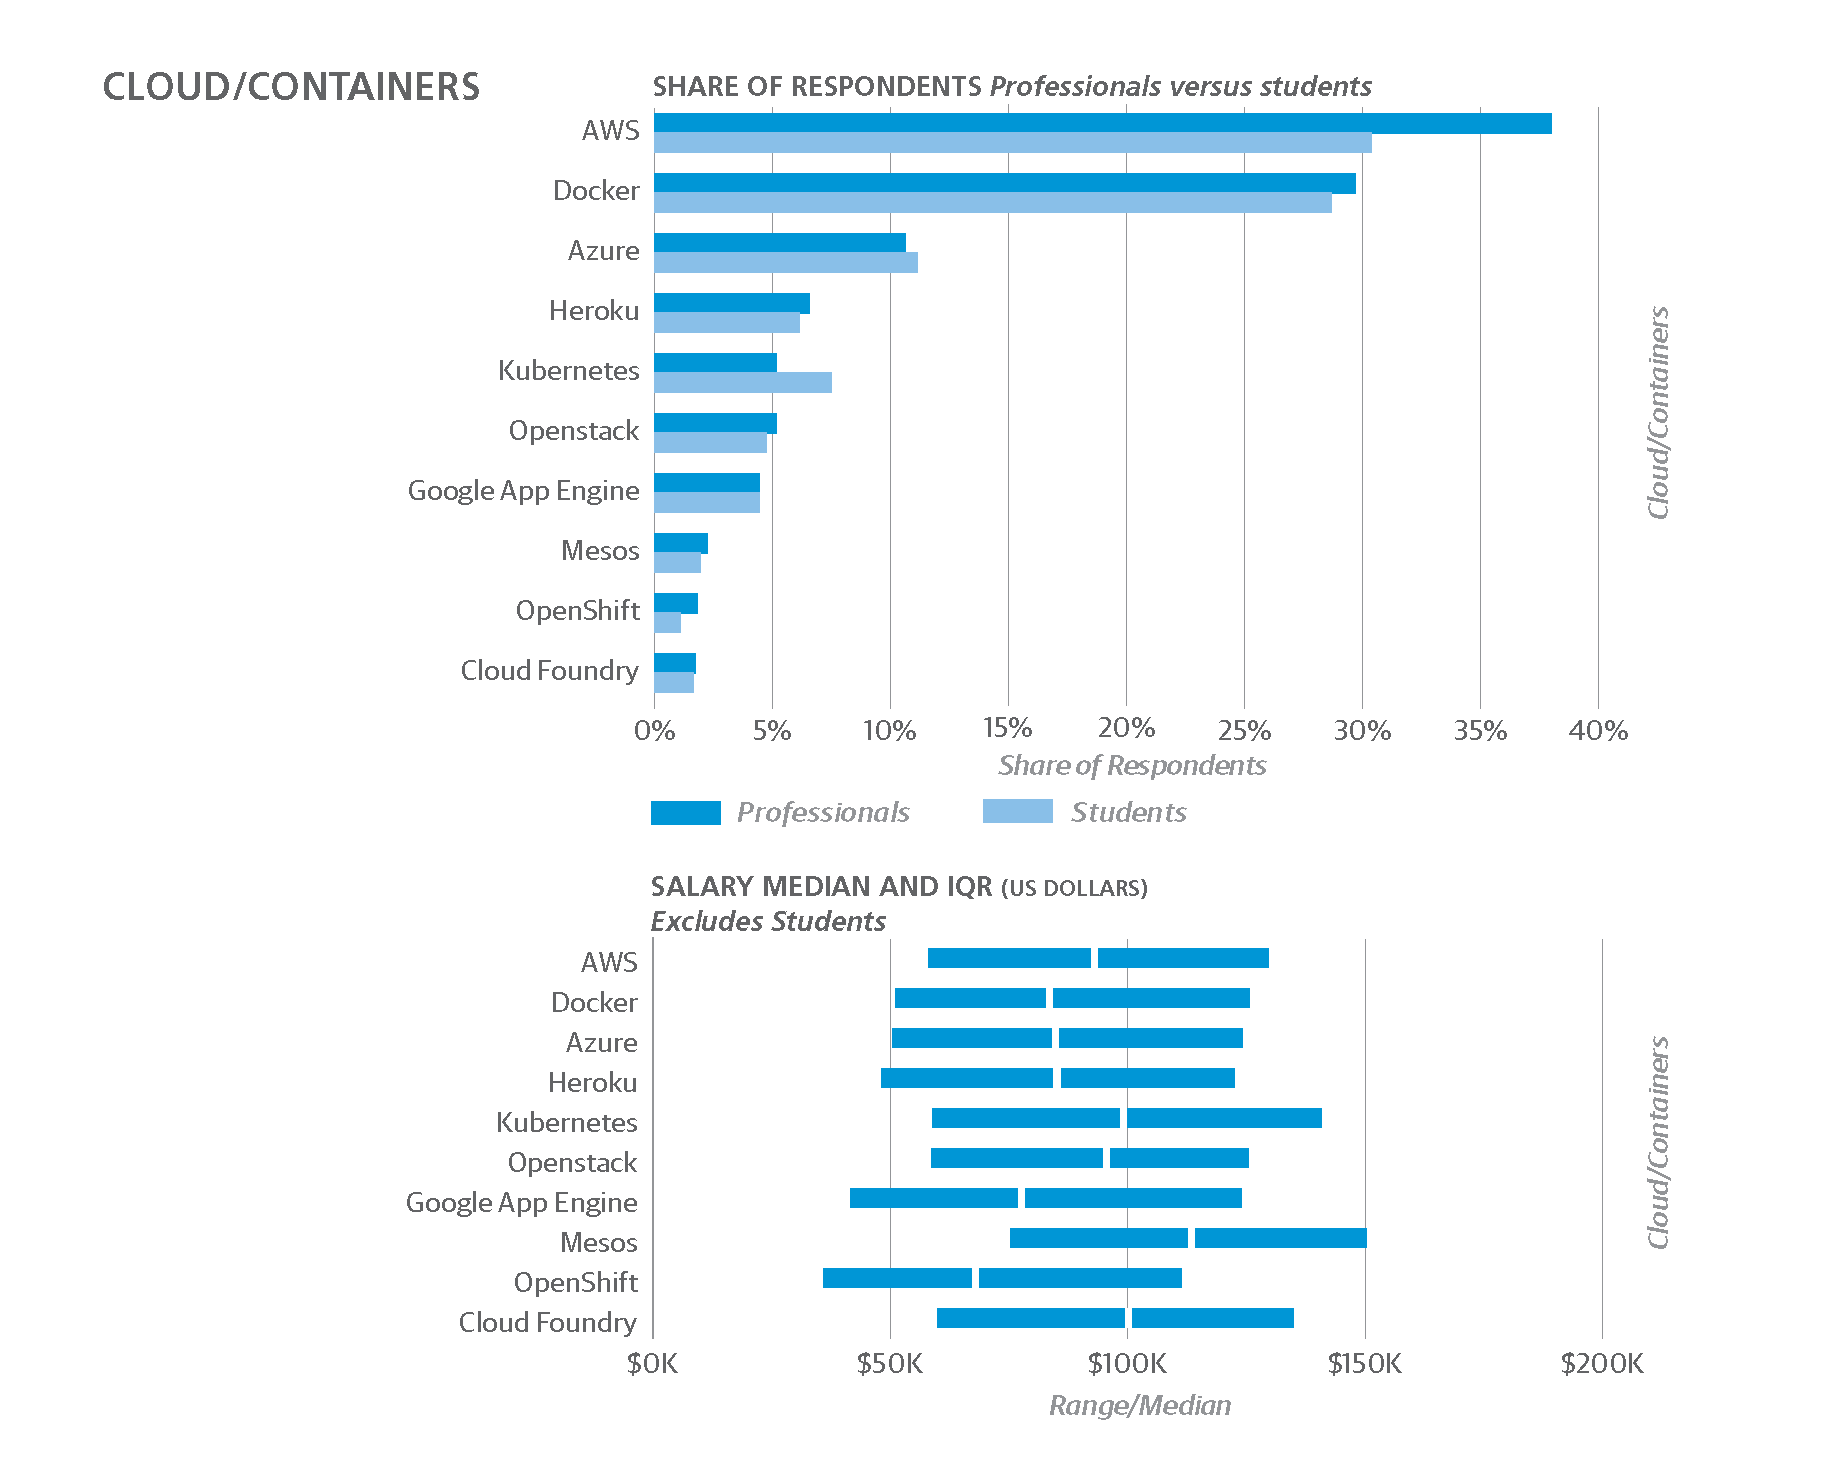
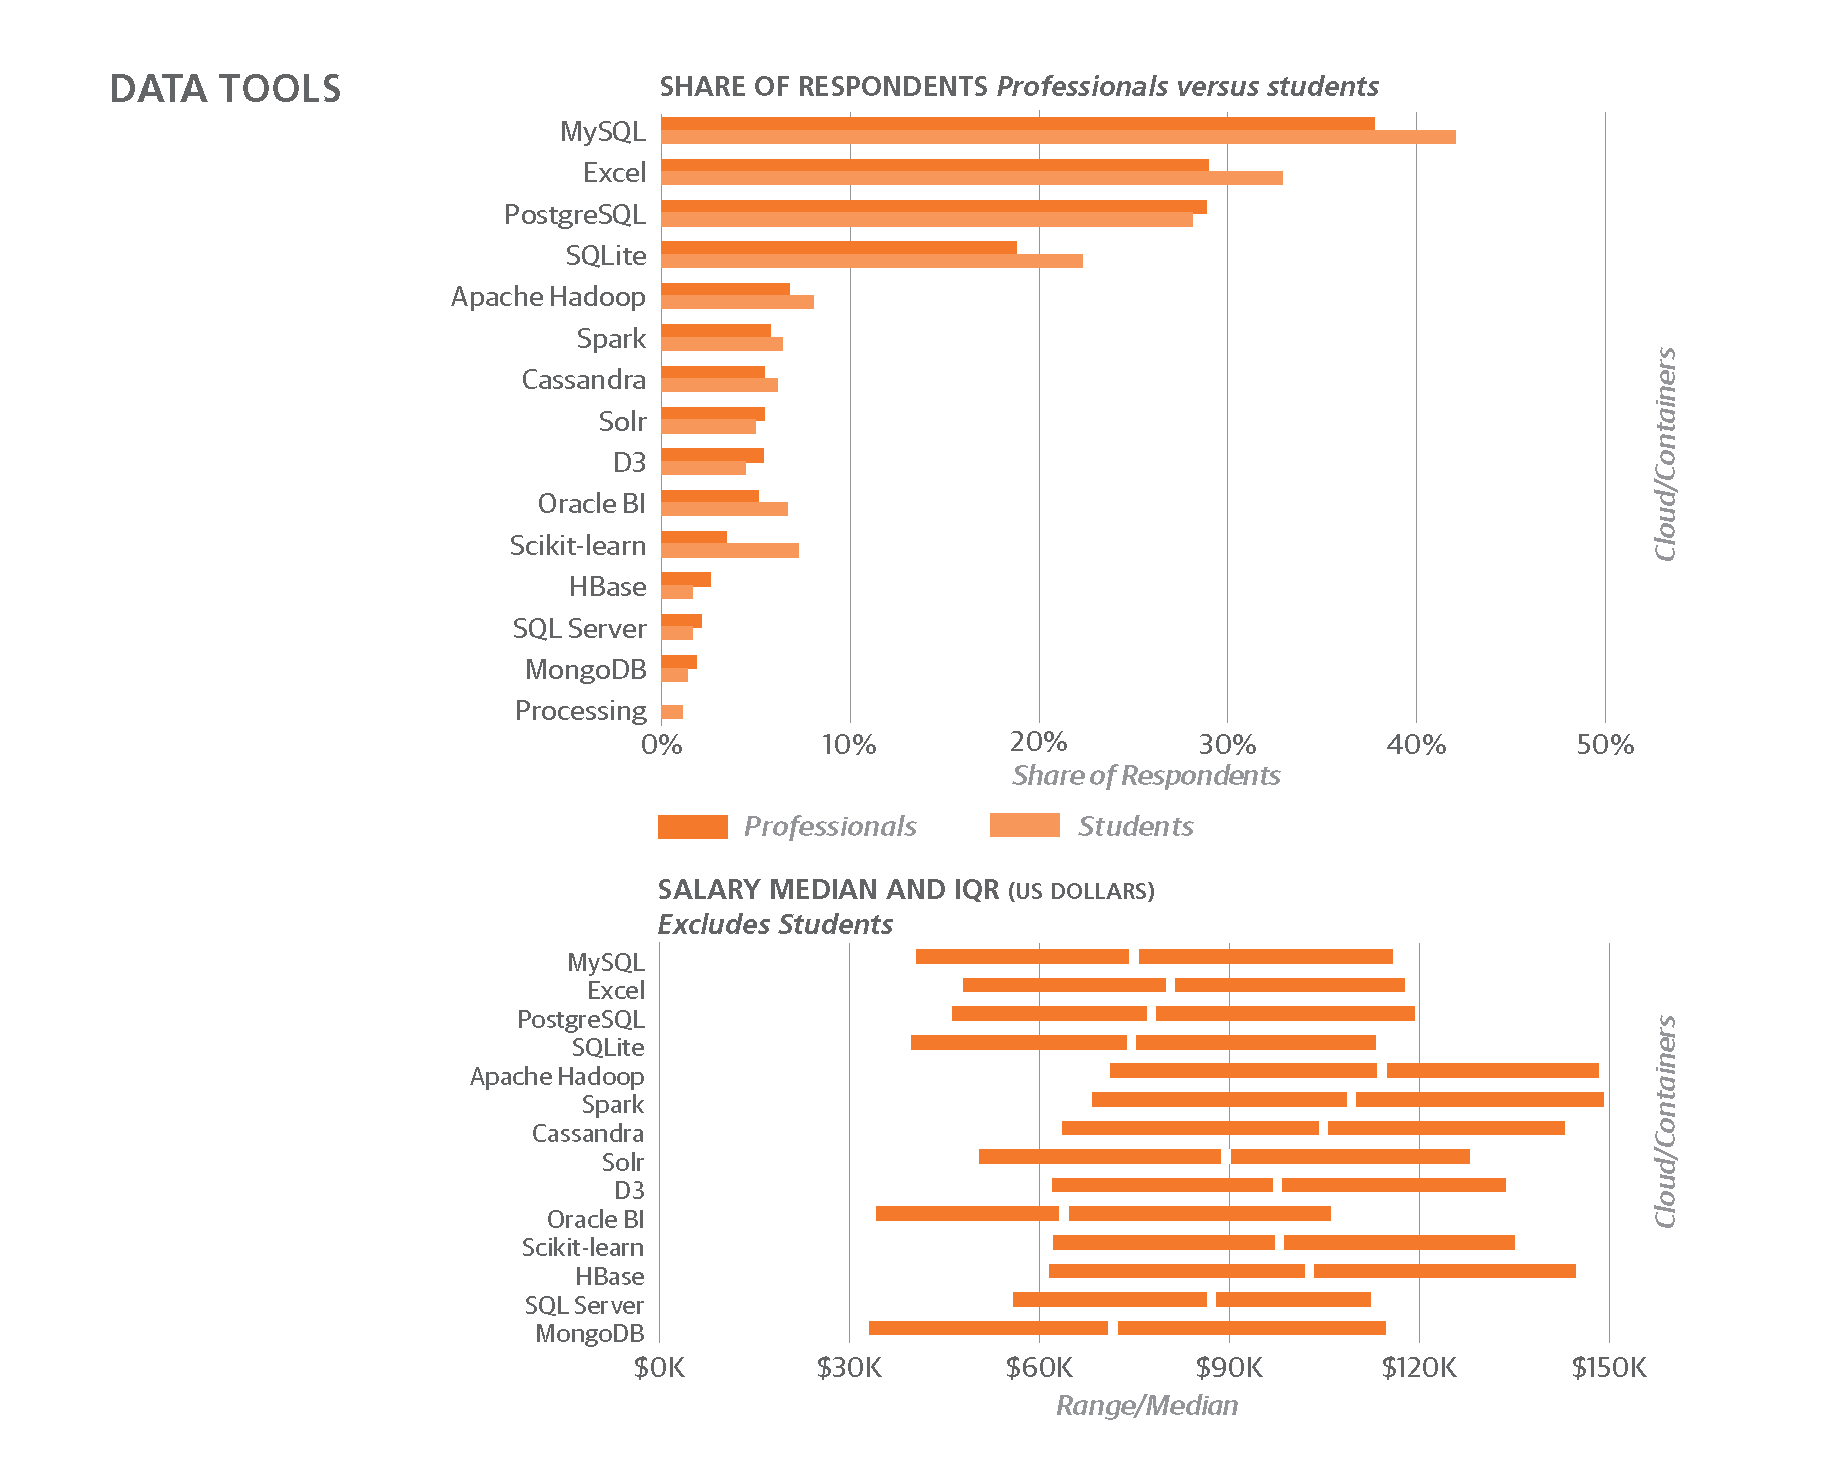
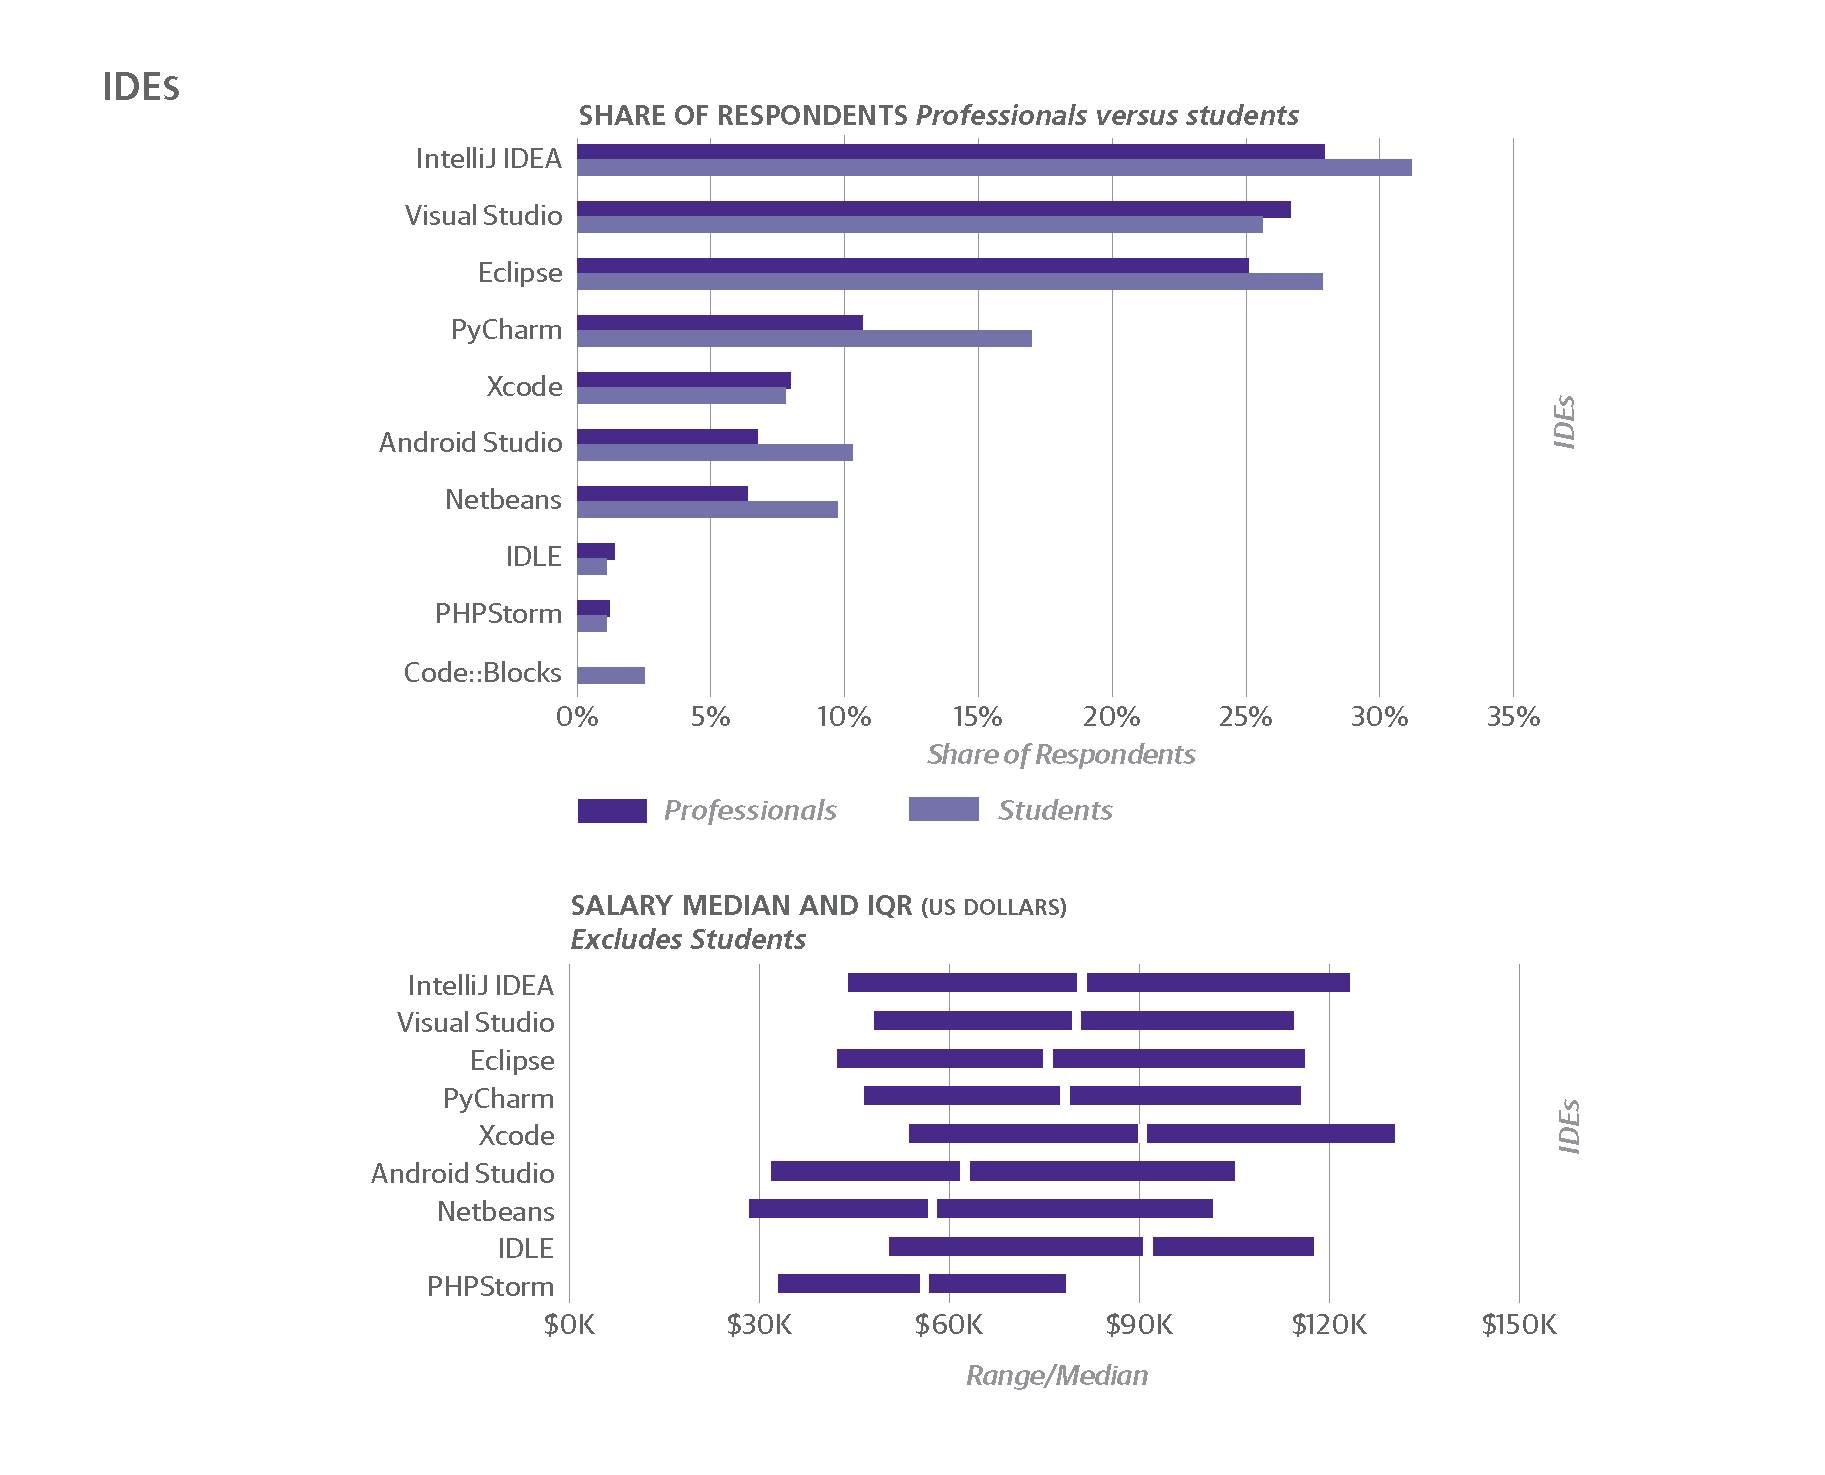
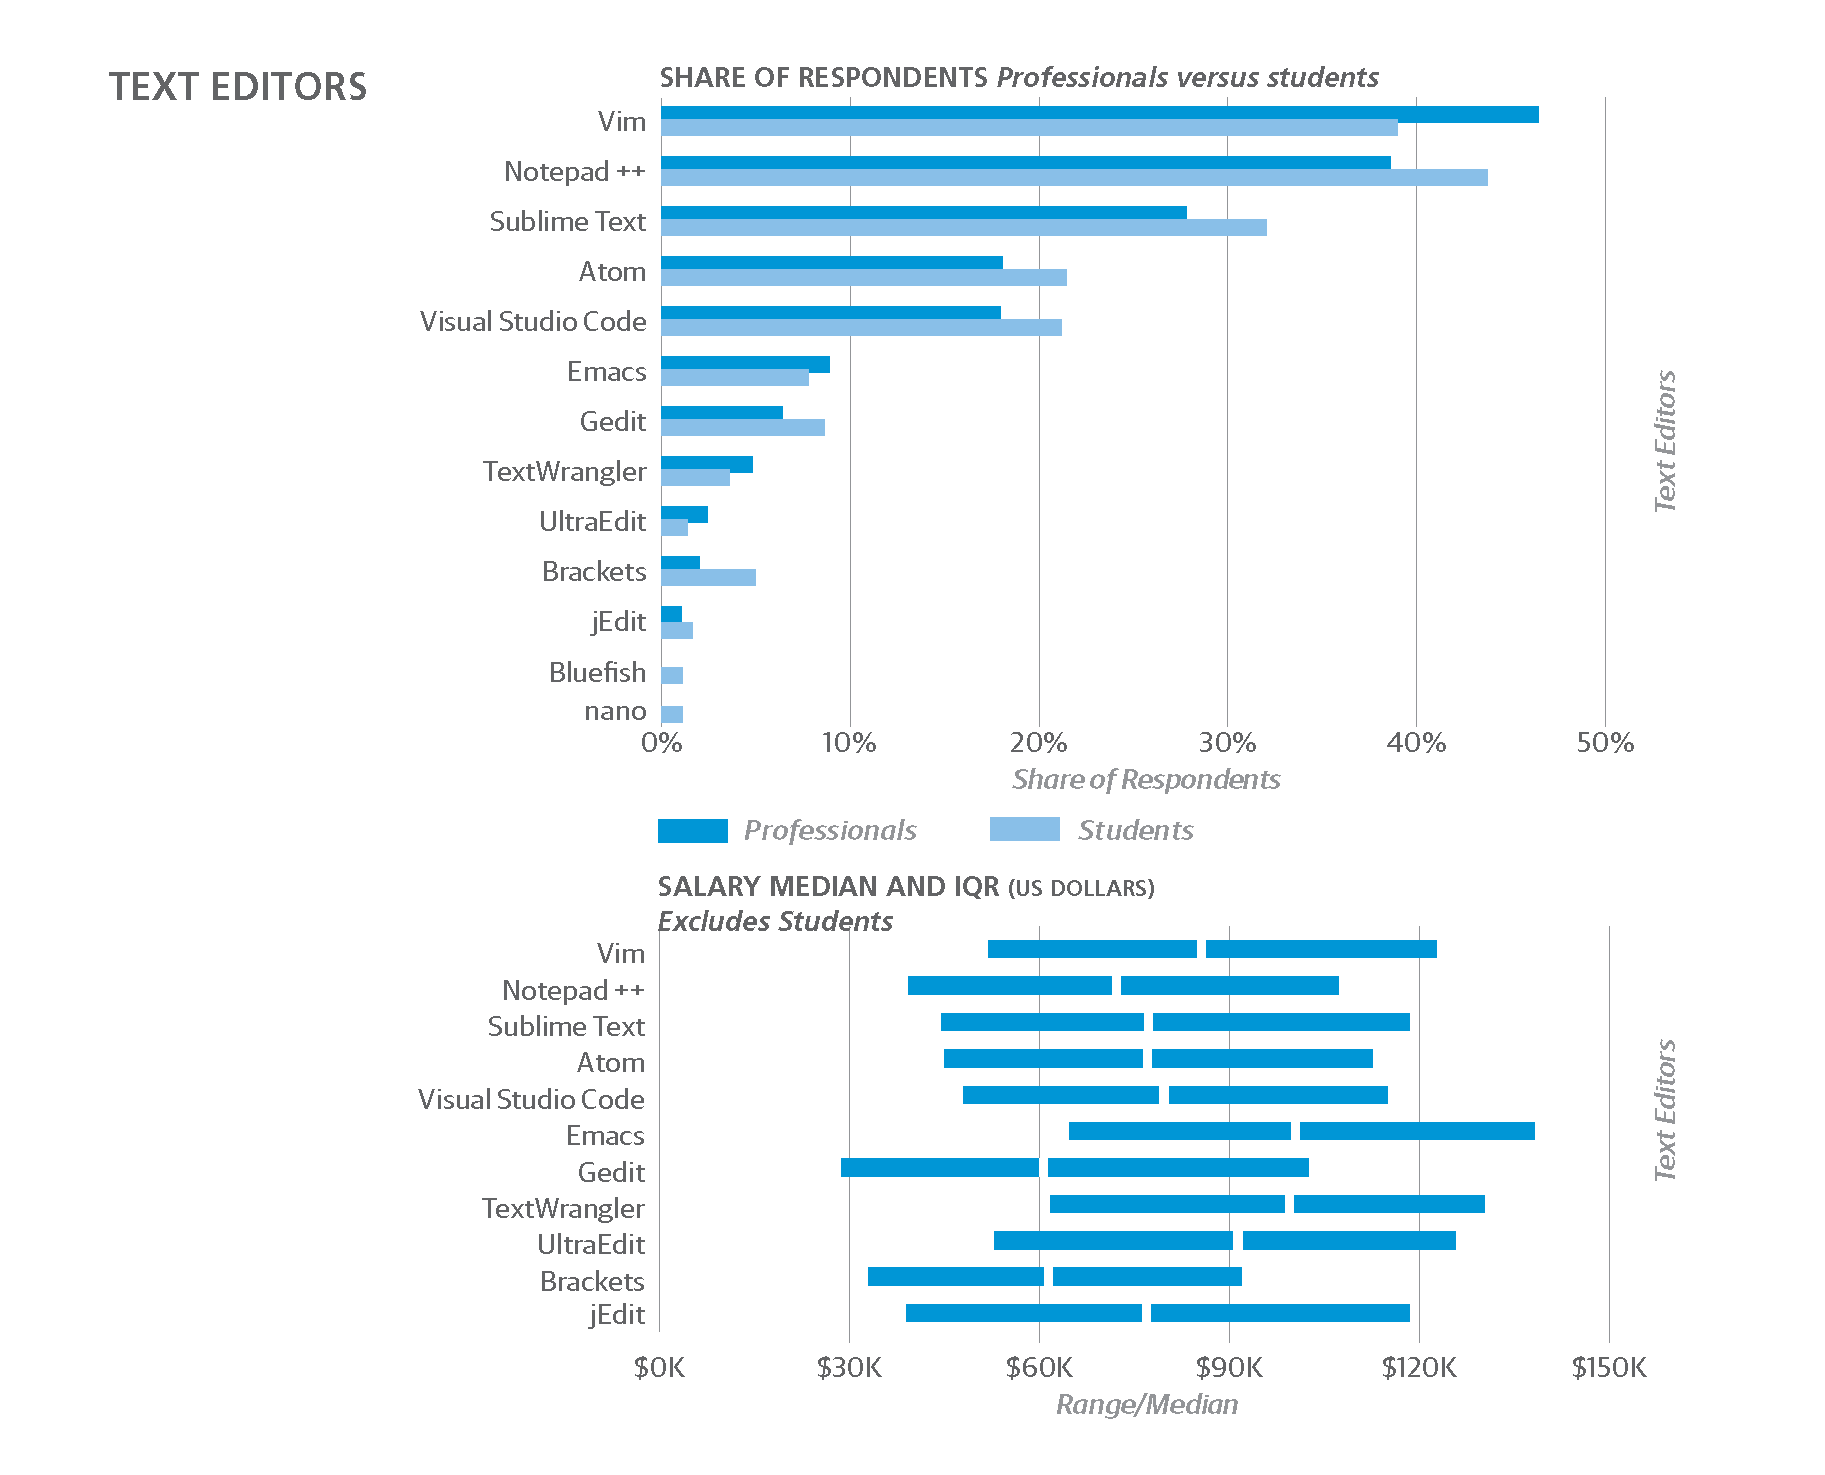
Tools and Programming Languages
NEW TOOLS ARE ALWAYS APPEARING and others maturing
and disappearing. Knowing what operating systems,
programming languages, text editors, IDEs, data tools, build
tools, cloud containers, and frameworks that people are using
allows us to see trends in the industry.
These charts include both student and non-student responses.
It is interesting to see which tools the next generation of
programmers are familiar with and which will potentially need
to be learned on the job.
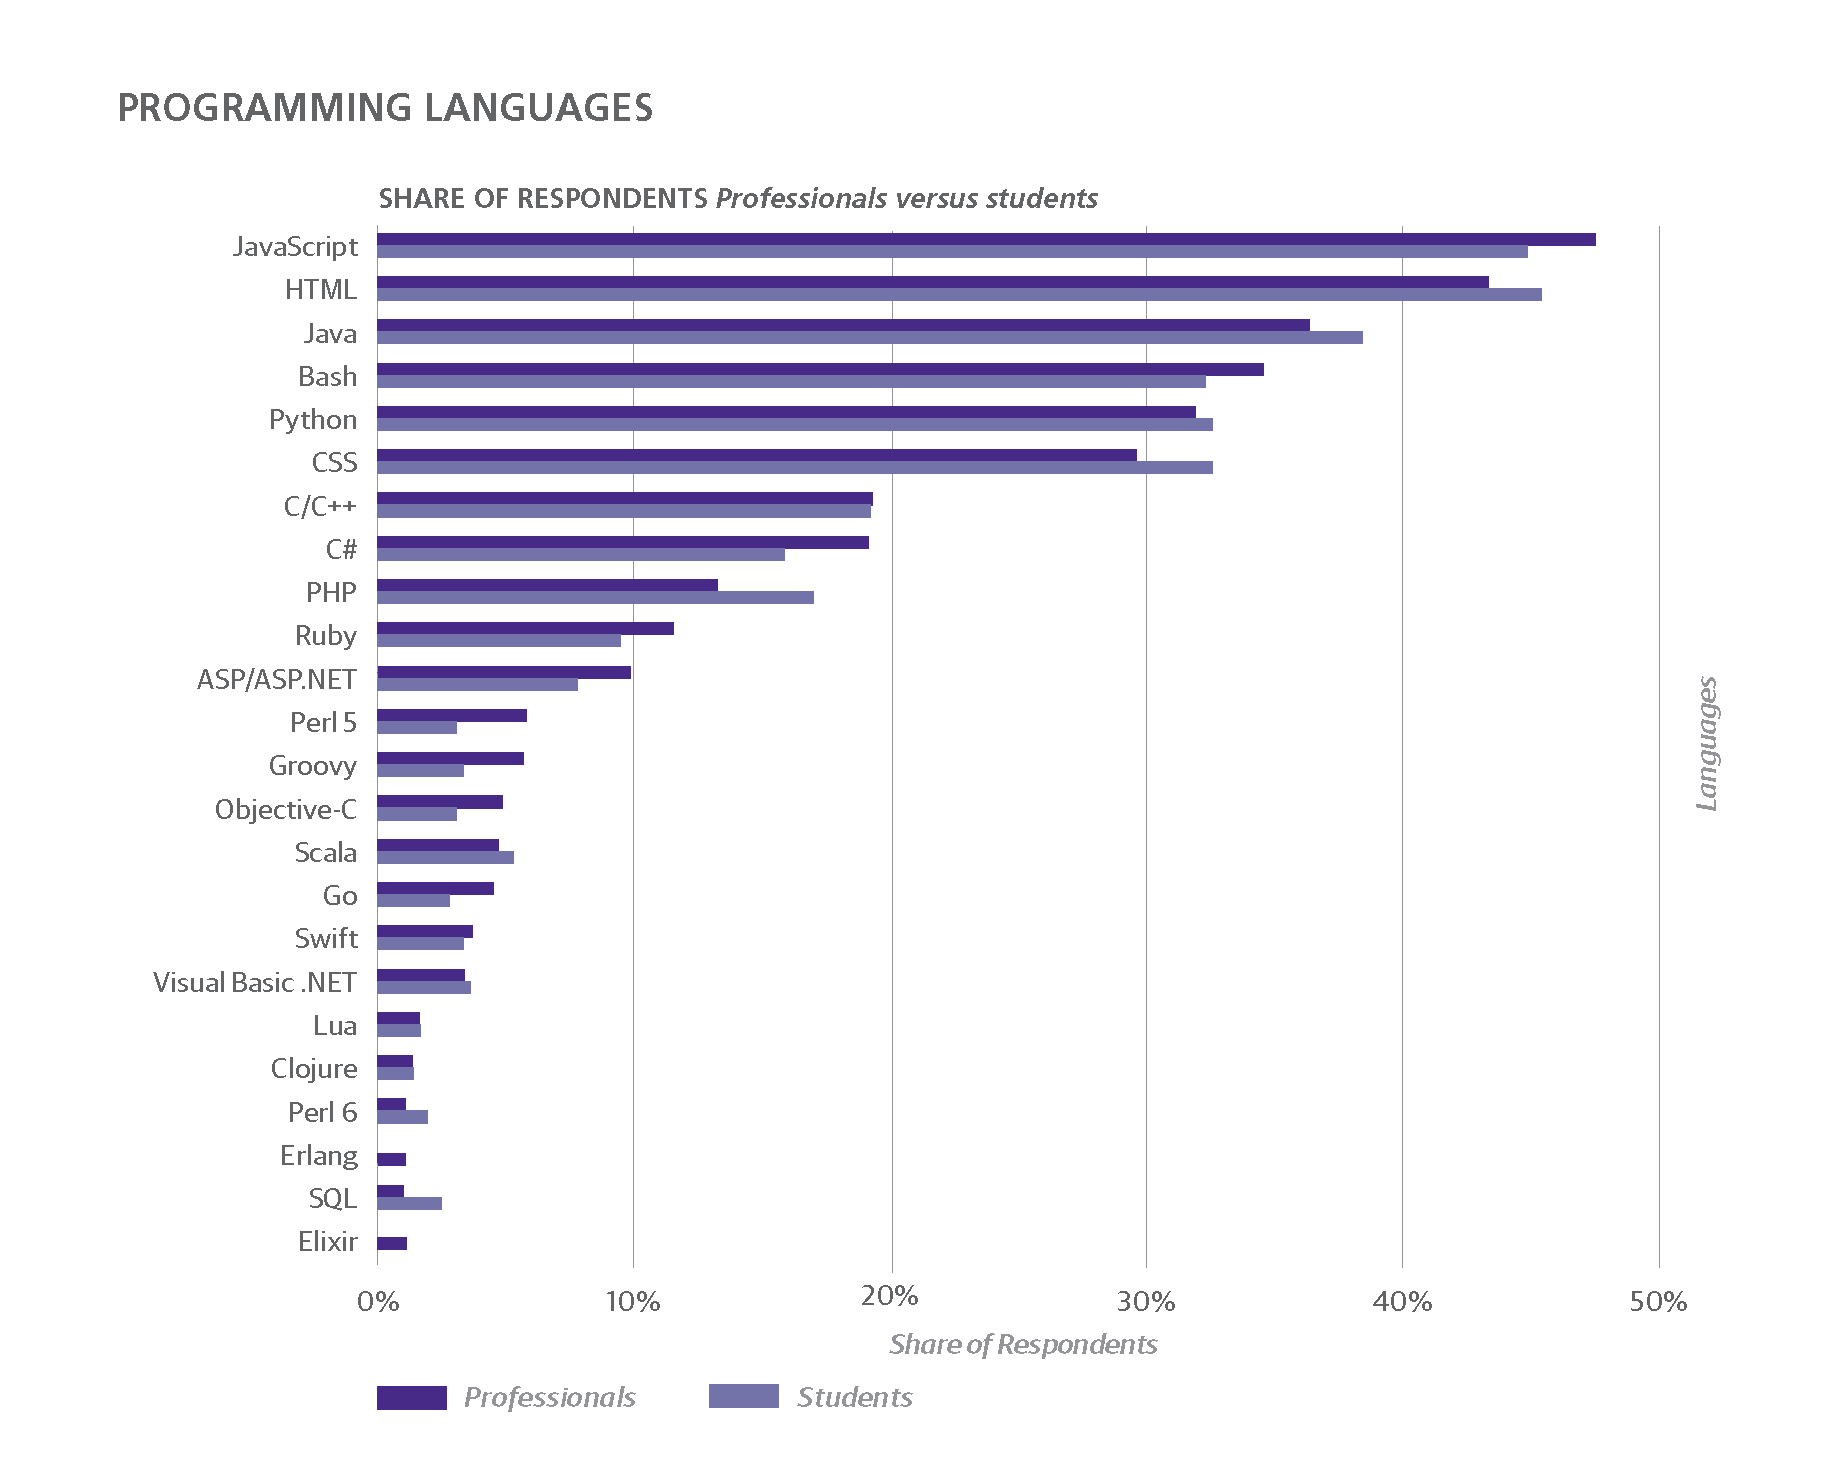
Our results show that programming languages, operating
systems, and platforms sometimes trend together. For instance,
Objective-C is being replaced by Swift in the future programming
languages category. We saw Objective-C drop 2% in
popularity compared to last year’s survey and Swift make its
first appearance on the list, coming in fourth at 15%. In the OS
category, macOS usage dropped almost 8% compared to last
year’s survey. Similarly, iOS development dropped a percentage
point (from 11% to 10%), but Xcode use increased 6%.
There are now more Android developers than last year (12%
versus 11%). Android Studio made its first appearance as an IDE
this year, with 7% of our respondents using it. Java holds strong
as a popular programming language (36%) and as a past and
future programming language (24% and 7%, respectively).
While Android is written mainly in Java, Google’s other programming
language, Go, is also a hot topic. Only about 4.5%
of the respondents say they use Go, while less than 2% say
they’ve used it in the past, but it’s a new language, so this is
understandable. Go ranks first among future programming
languages, with 23% of the respondents wanting to learn
it. When we look at the 2016 survey results, we see a similar
number: Go was also the highest ranked programming
language to learn (23%). Many want to learn Go, but people
either don’t seem to have the time or Go isn’t being adopted
enough within companies for folks to learn it on the job or for
everyday tasks.
Microsoft has made some big announcements in the last 12
months. From new hardware, to more open source offerings,
to software updates, they are definitely a company to
watch. So how has that affected usage? The percentage of
people using Windows has held steady at 62% over the last
two years. However, Microsoft’s main programming languages—
C#, ASP.net, and VB.net—have seen a decline in their
everyday usage (2%, 3%, and 2%, respectively). In terms of
languages that people want to learn, C# has seen a slight 1%
increase, Visual Studio IDE is down slightly (2%), and their
cloud platform Azure is up 1%.
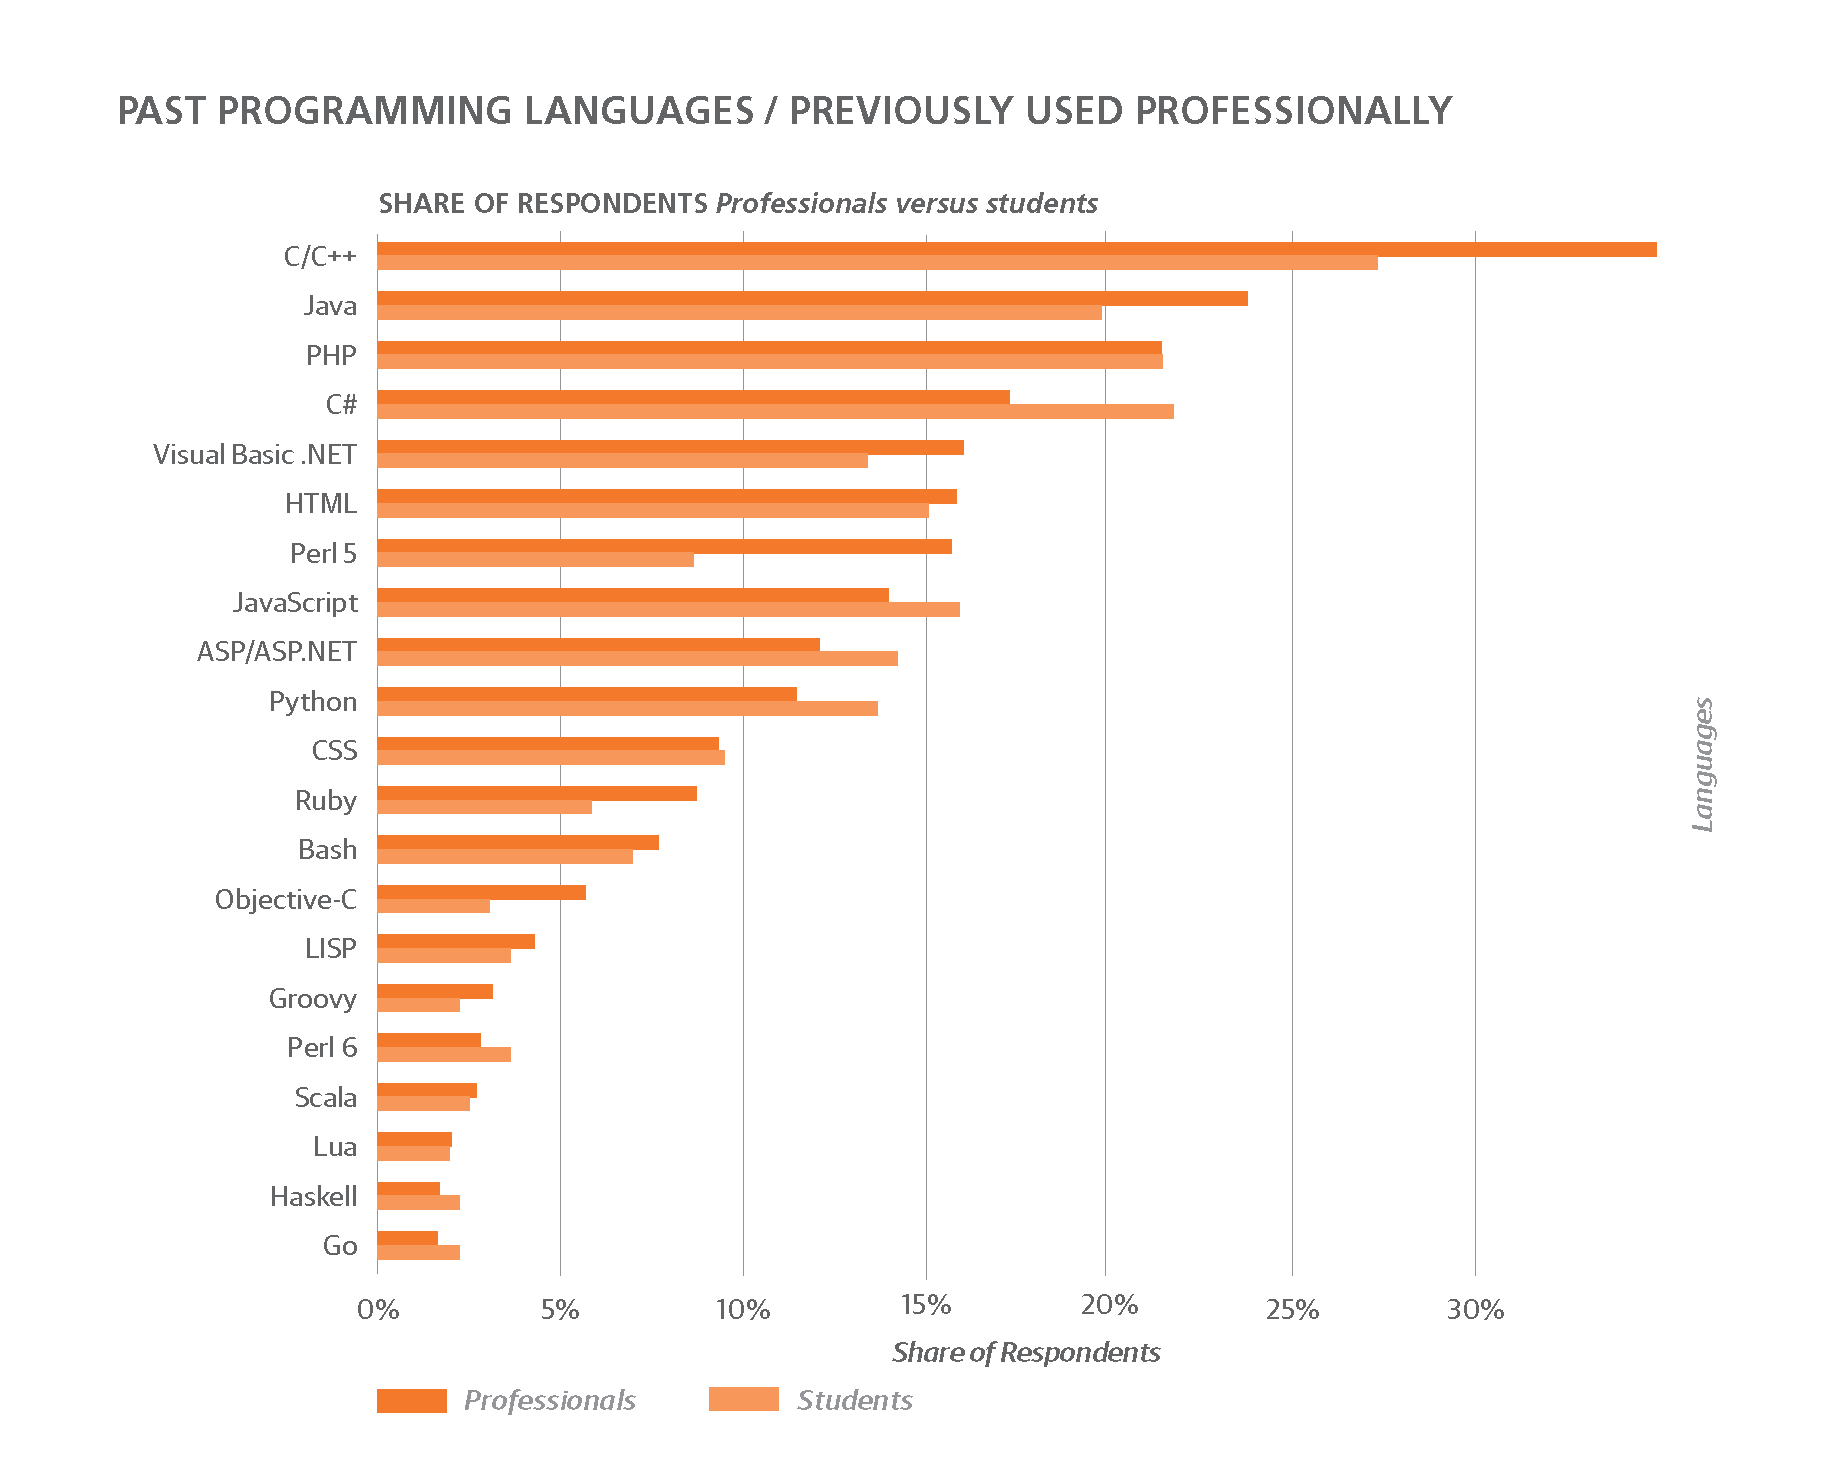
Past Languages
The top three programming languages our respondents have
used professionally in the past haven’t changed much over the
last year. C/C++ (35%), Java (24%), and PHP (21%) dominate
the top of the list, just like last year.
There are small changes with less popular languages. VB.NET
(16% of respondents) and ASP.NET (12%) have dropped
1%–2% compared to last year, most likely being replaced
with C#. HTML increased from 13% to 16%, and JavaScript
went from 12% to 14%.
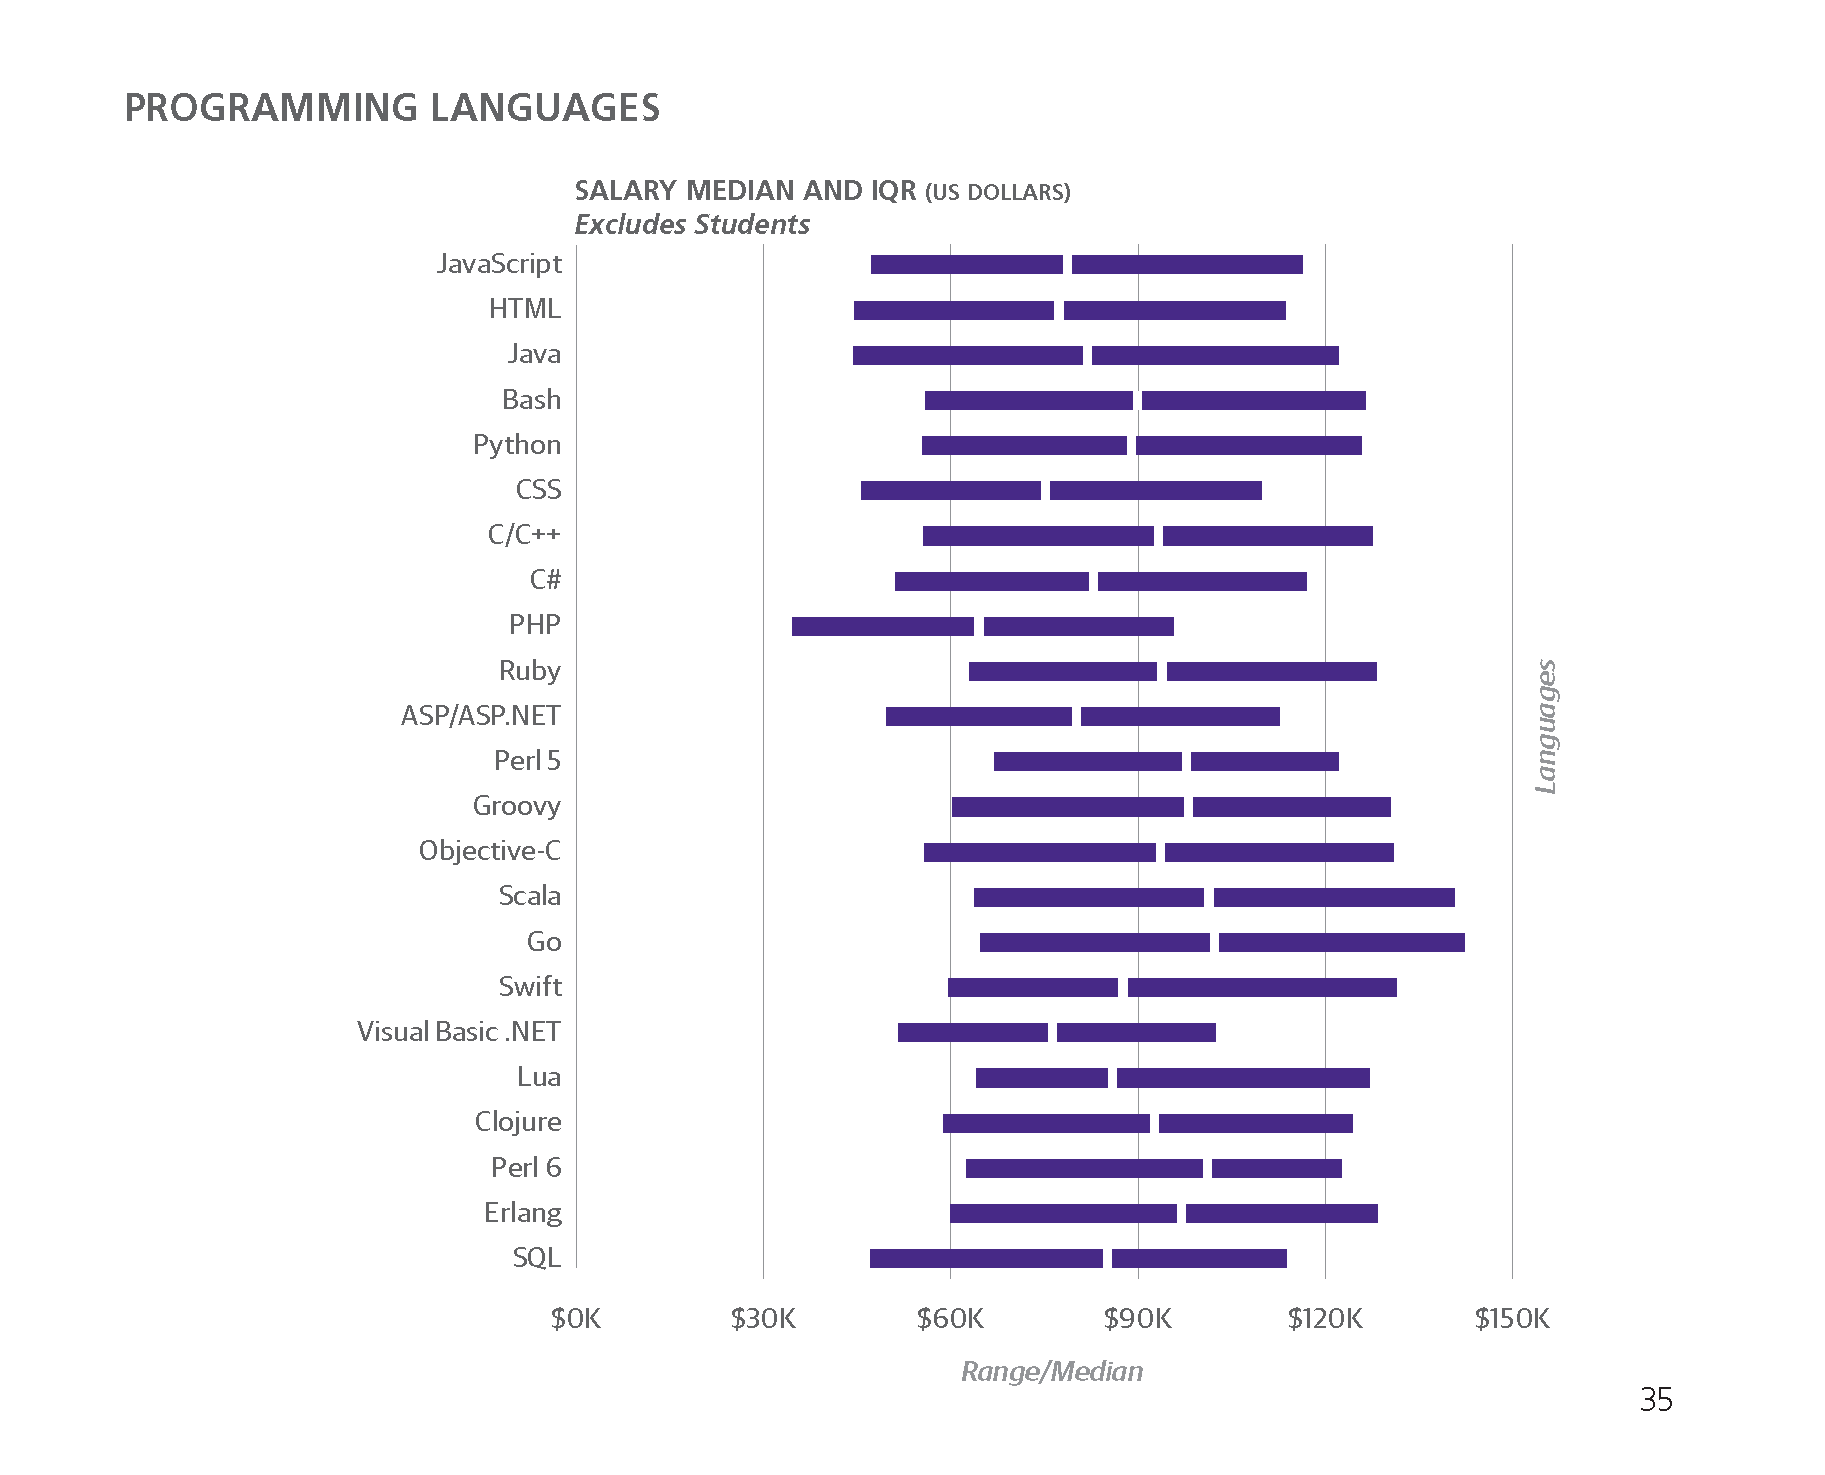
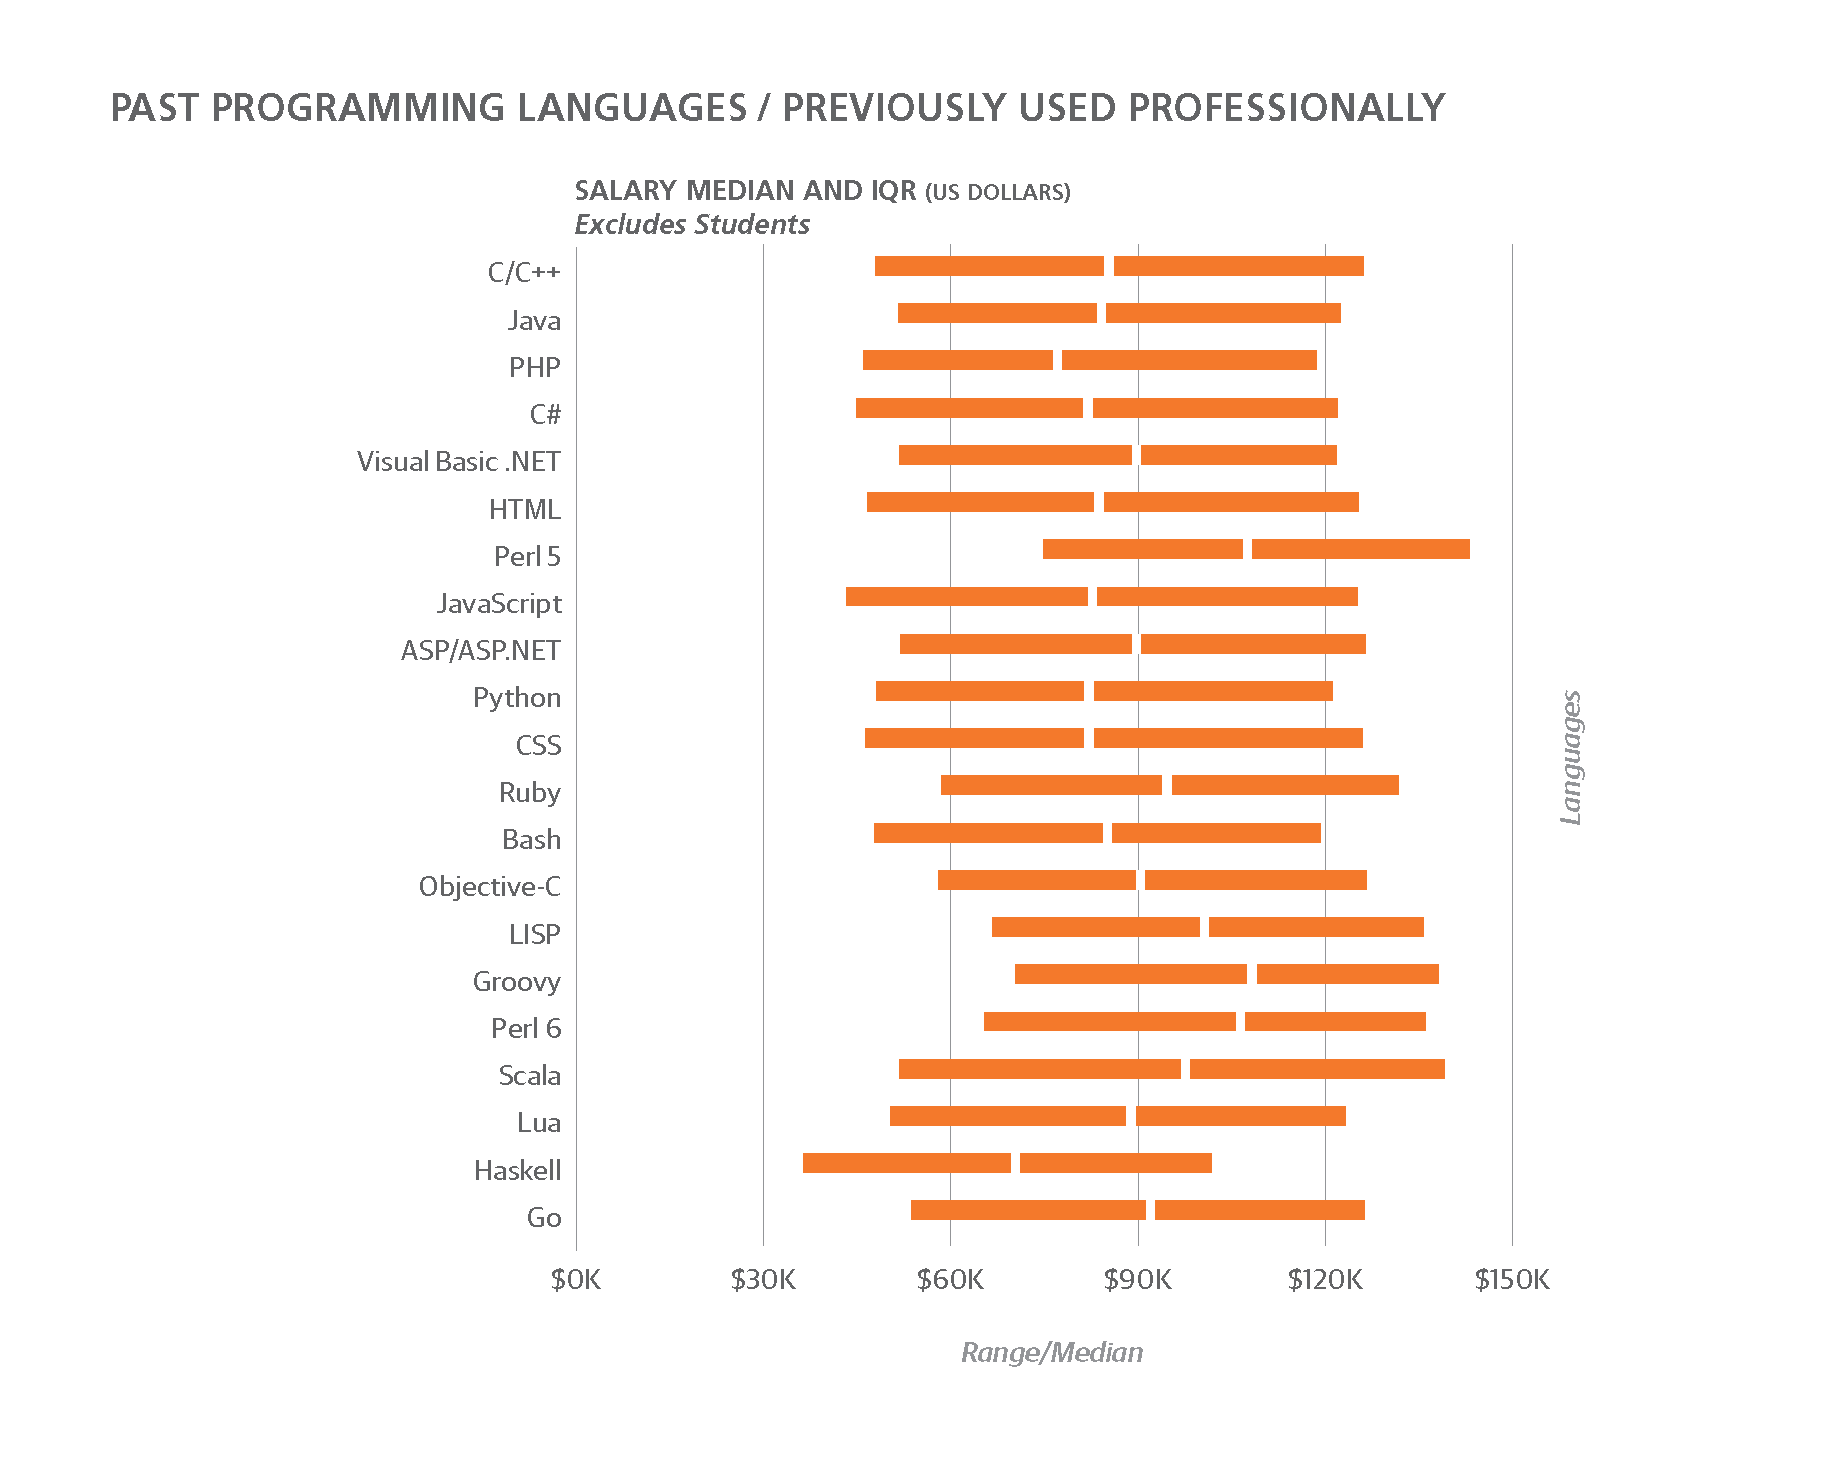
The popularity of a programming language is not a good
predictor of salary, which makes sense: sometimes obscure
languages are in demand for specific applications and the few
people who know those languages can make a lot of money.
Other languages are widely known, but since they are also
widely used in many different applications, they pay well. C/
C++, for example, garners a median salary of $85K—higher
than our average.
Perl 5, Perl 6, and Groovy all have well-paid median salaries
($110K), with the top 25% of respondents who used these
languages making more than $130K.
Student responses about past programming languages are
interesting because these are folks who will be entering the
workforce. What they are taught at school and what they are
learning on their own can be an indicator of what’s to come.
C/C++ dominates the top spot, just as with non-students,
with C# coming in second at 22%. This is important because, for non-students, C# is fourth at 17%. Only 20% of students
have used Java, compared to 24% of non-students. These
are interesting indicators that students are being taught more
C# and less Java. In the near future, we might see a need for
more Java training and/or a rise in C# programming.
2.5% of students are familiar with Swift, Apple’s new programming
language, but Swift is not on the list for non-students.
Go is also interesting in that 3% of the students have
some experience with it, whereas only 1.6% of the non-students
do. Since both of these languages are fairly new, it’s understandable
that students have more exposure to them, and
more time to experiment with and learn them. Non-students
might have less free time and be required to use languages
their employers have chosen.
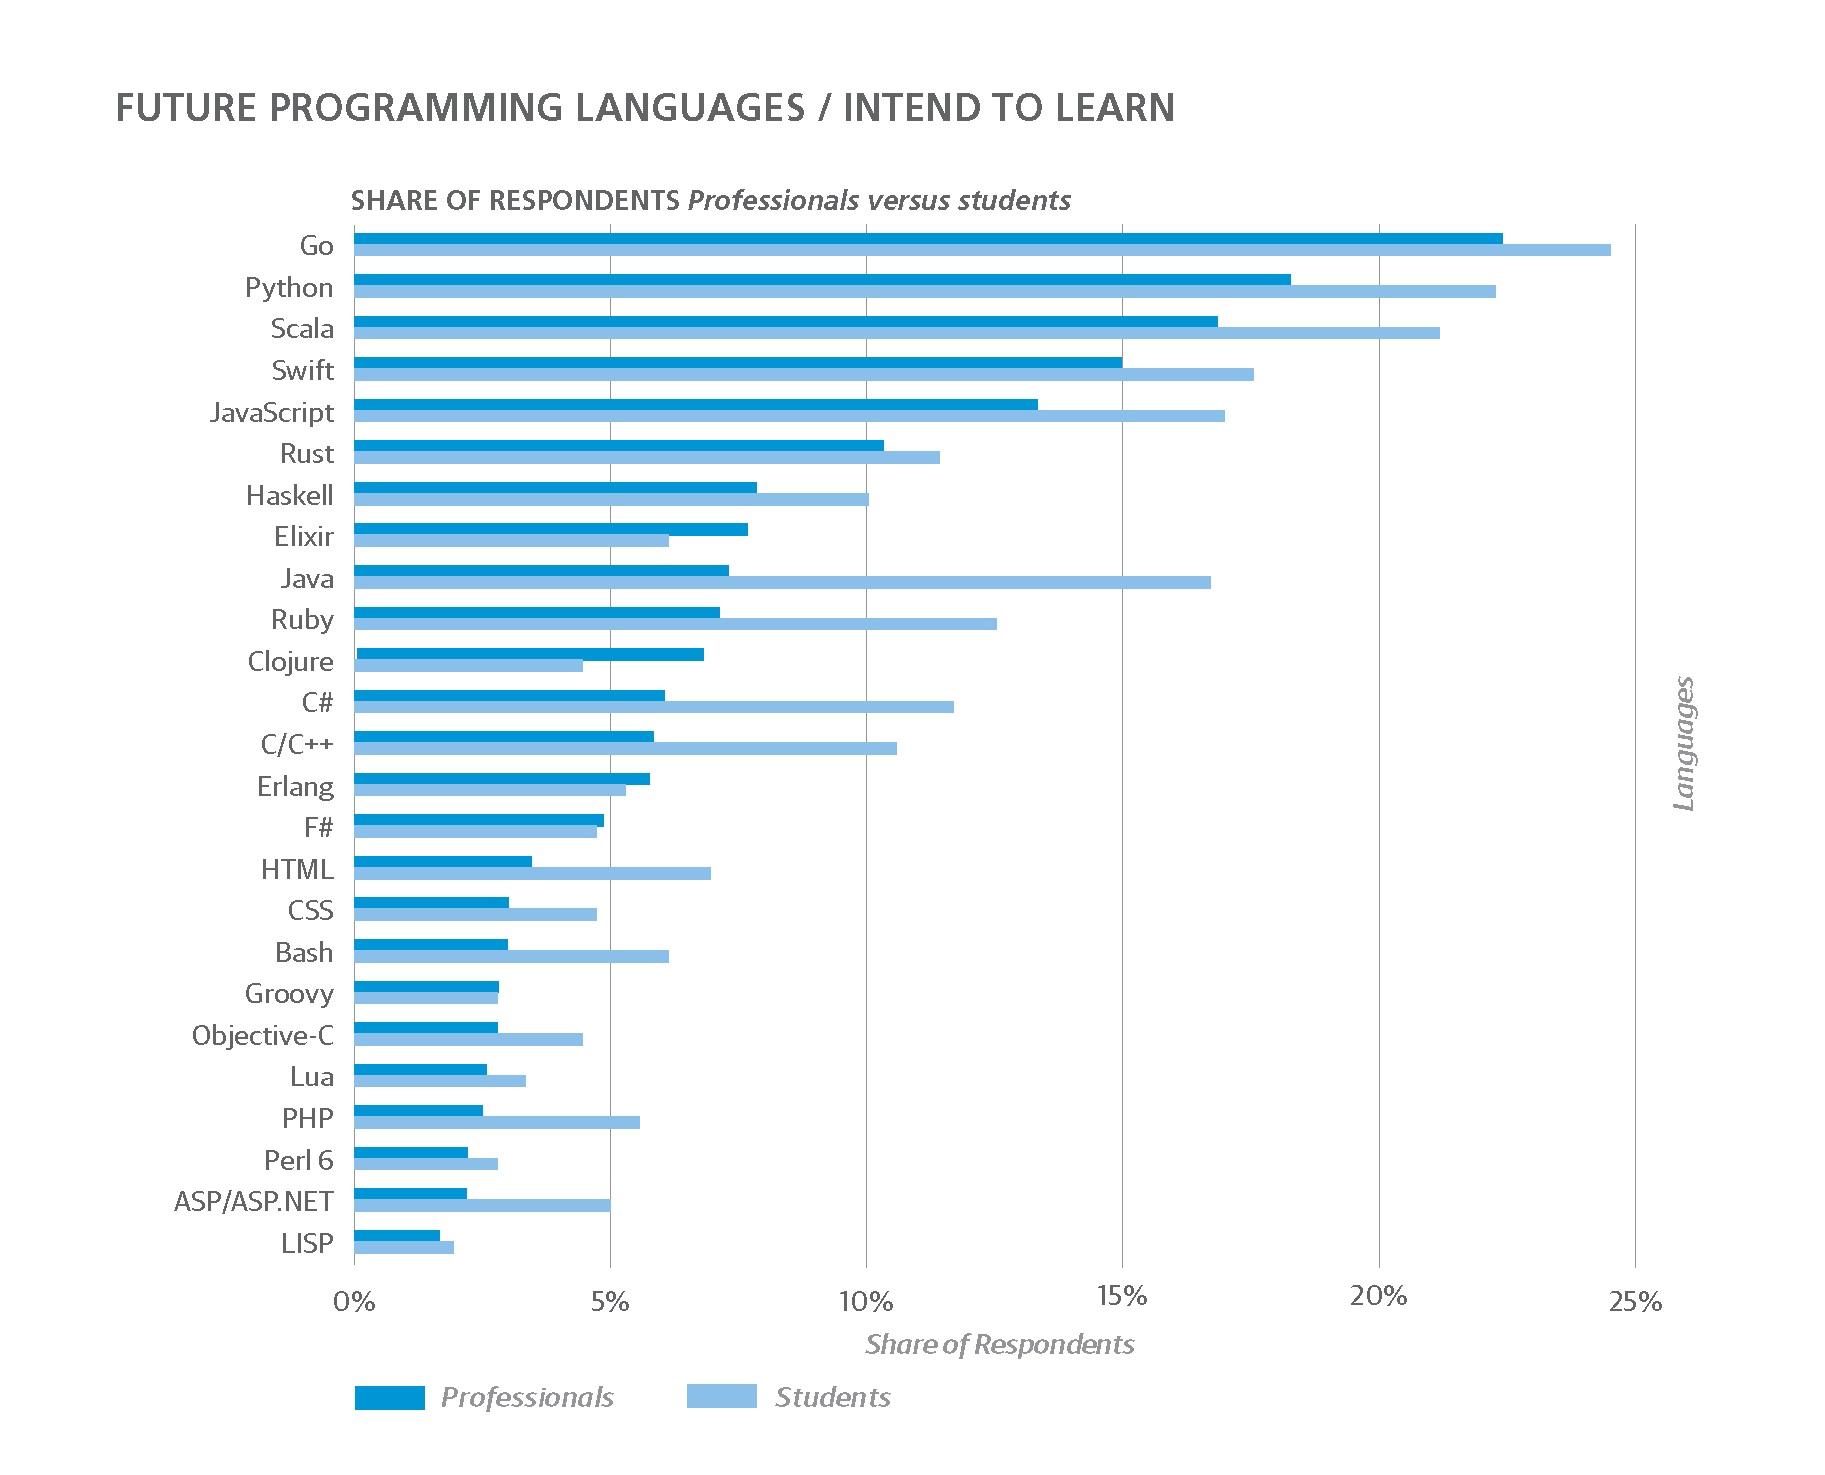
Future Languages
Everyone wants to learn more Go, Python, Scala, Swift, and
JavaScript (in that order). These are the top five languages
that both students and non-students hope or intend to learn.
For students, Java, PHP, and C/C++ are highly desirable, too,
which makes sense because those are the languages being
used in companies, so knowing them can help students enter
the workforce. For non-students, Rust, Haskell, and Elixir are
also high on the list of languages they want to learn.
Work Evaluation
A CAREER IS SO MUCH MORE THAN JUST WORK AND PAY.
This year’s survey contained several subjective questions that
were meant to capture how respondents felt about their jobs.
It turns out you don’t always have to make sacrifices to get
better pay. Respondents who are happier with their situations
and have better work/life balance also have better salaries.
You don’t have to be miserable
to be paid well.
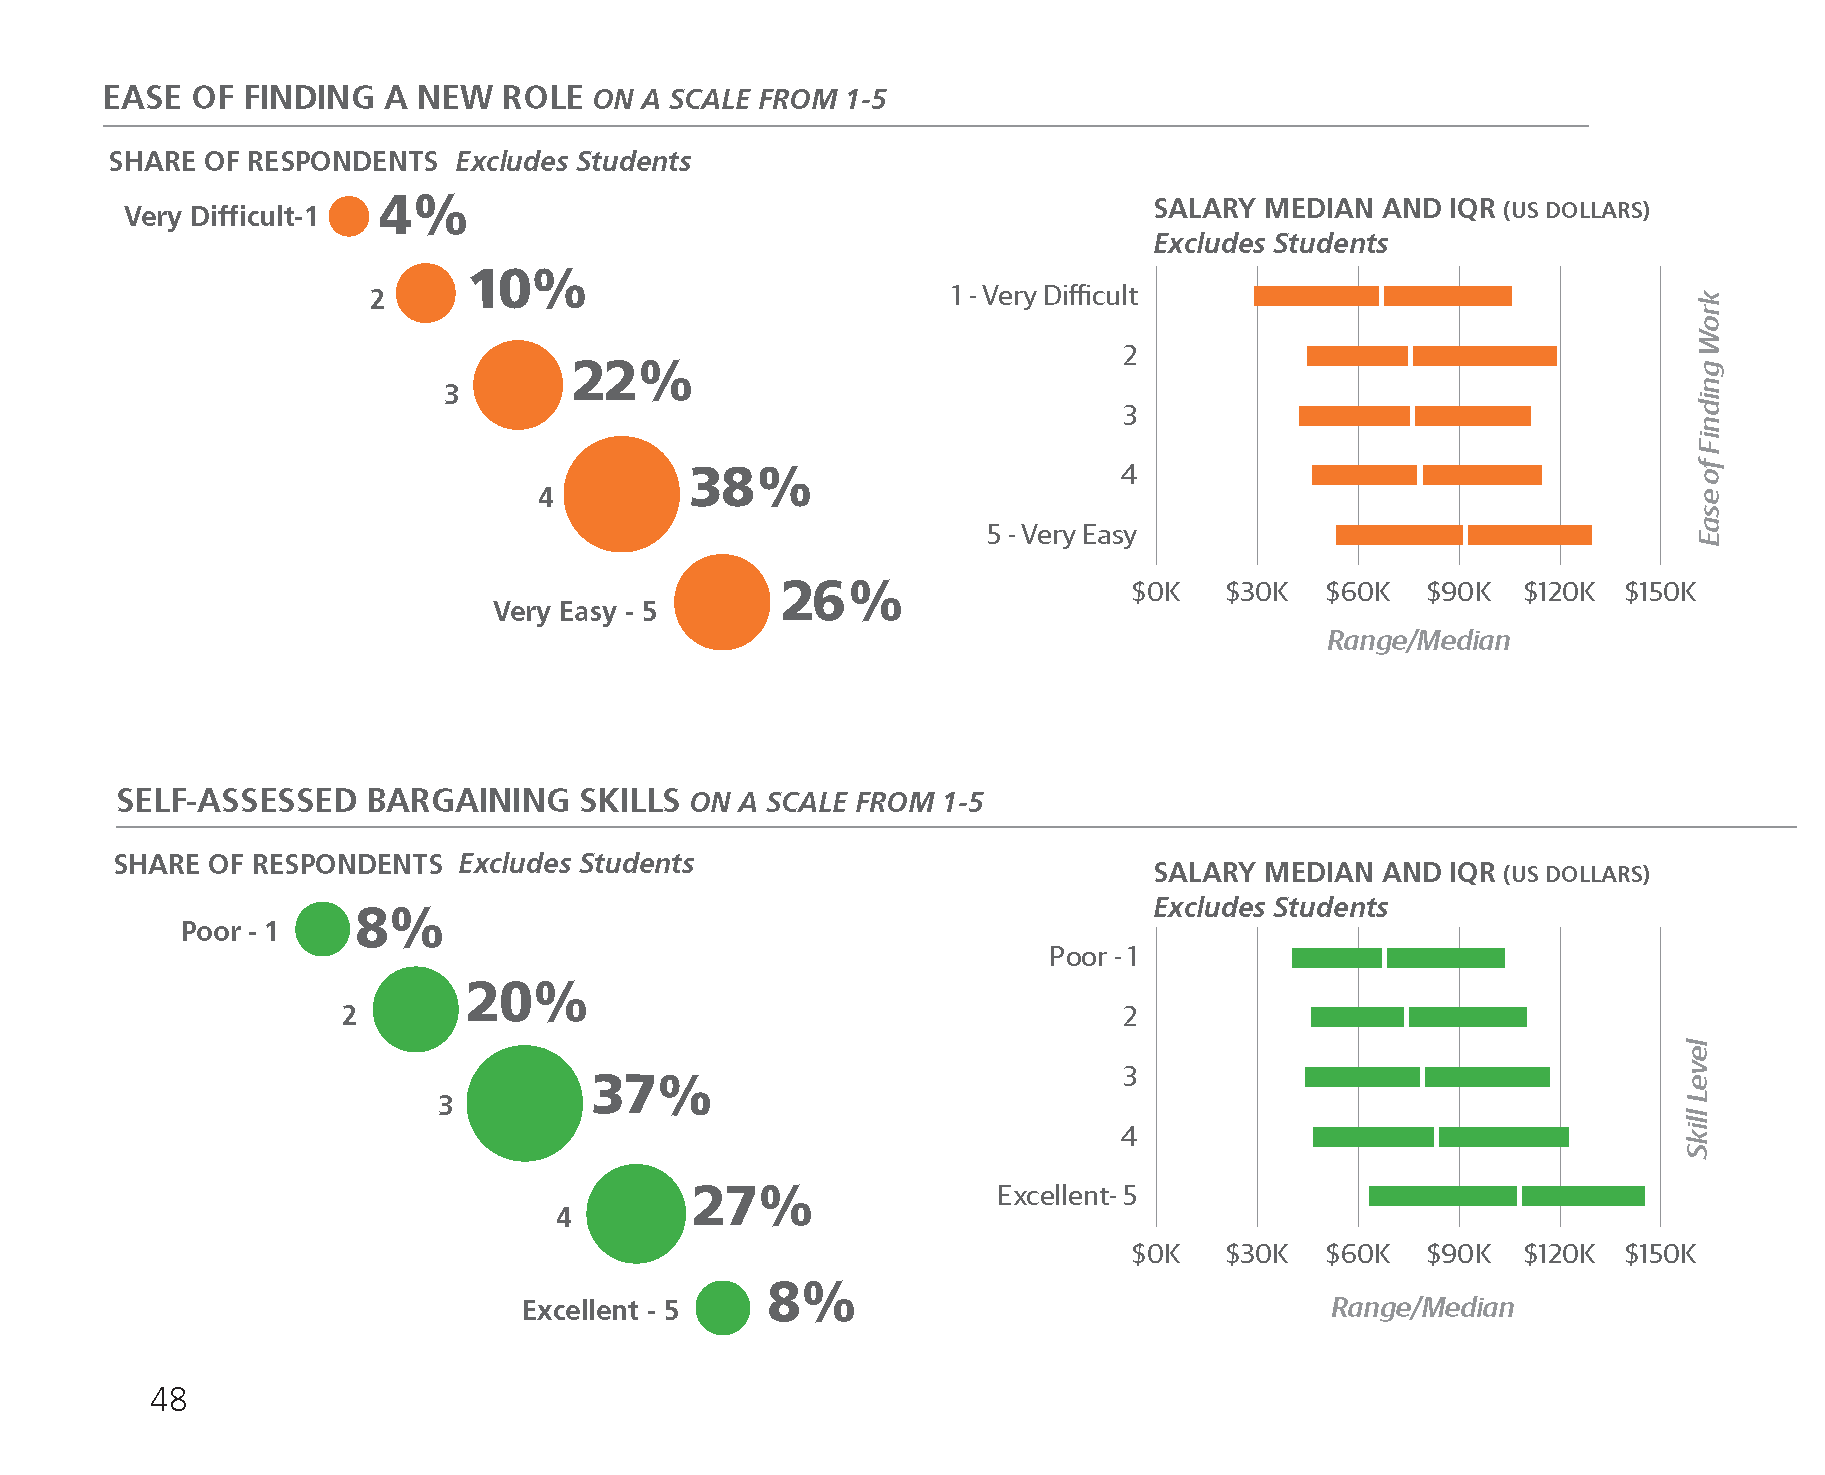
Respondents were asked to
rate, on a scale from 1 to 5
(1 = poor, 5 = excellent), how
easy it would be to find a new
job more or less equivalent to
their current position. This was
used to gauge how well people
could move laterally through companies. 64% of respondents
were positive (4 or 5) that they could move with ease. The
students also shared this high level of optimism, with 60%
answering positively.
Our respondents were less confident about negotiating and
bargaining for a better salary or perks. When asked about their bargaining skills, 38% answered 3 (not bad but not
great), 34% responded positively (4 or 5), and 28% felt they
lacked these skills (1 or 2).
When we look at just the self-assessed better bargainers
(those who responded 4 or 5), we see that they do indeed
have much better salaries than other respondents. The best
self-assessed bargainers,
those who responded 5,
were earning around $107K,
whereas those who responded
3, had salaries nearly $38K
lower! This data suggests
that perhaps the best way to
improve your salary is to spend
time (and maybe even money)
becoming a better bargainer.
If we dig a bit deeper into some of the non-salary aspects of
a job—such as flexibility, work/life balance, location, growth
opportunities, and company culture—we see a striking increase
in salary as people rate these categories higher.
Note
This year’s survey contained
several subjective questions that
were meant to capture how
respondents felt about their jobs.
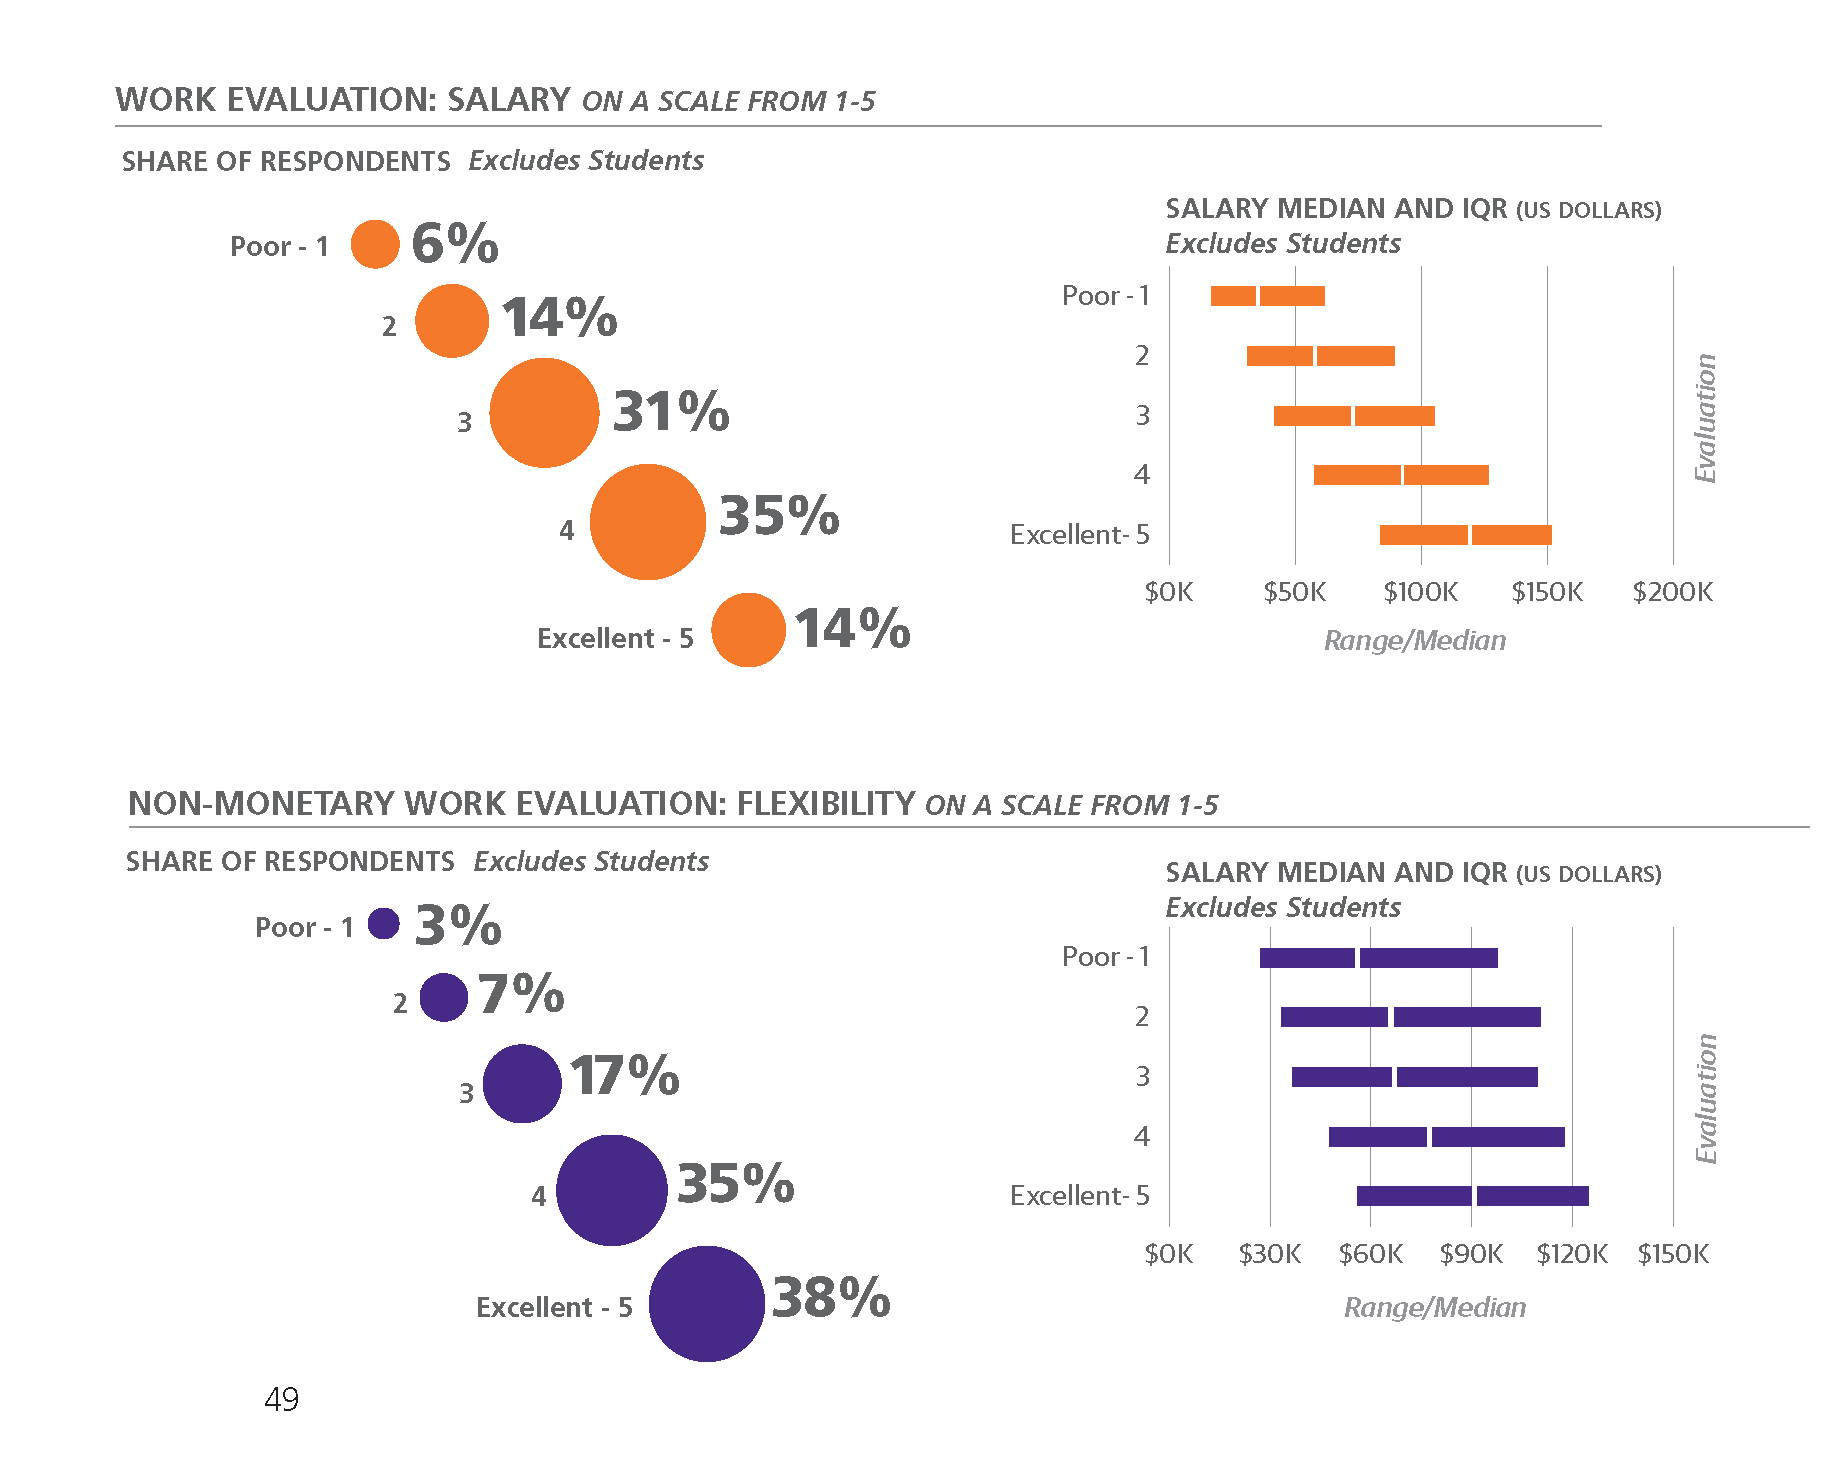
The vast majority of people are very positive toward their
work flexibility: 73% responded with a 4 or 5, and their median
salaries were $77K and $91K, respectively. Only 9% had a
negative view of their work flexibility (1 or 2) and their salaries
were $56K and $66K, respectively. The disparity between
the lowest and highest median salaries based on flexibility is
around $35K. This is the largest difference in any of the Work
Evaluation categories. It seems that flexible companies also
pay their employees well, so you likely don’t have to sacrifice
income for flexibility.
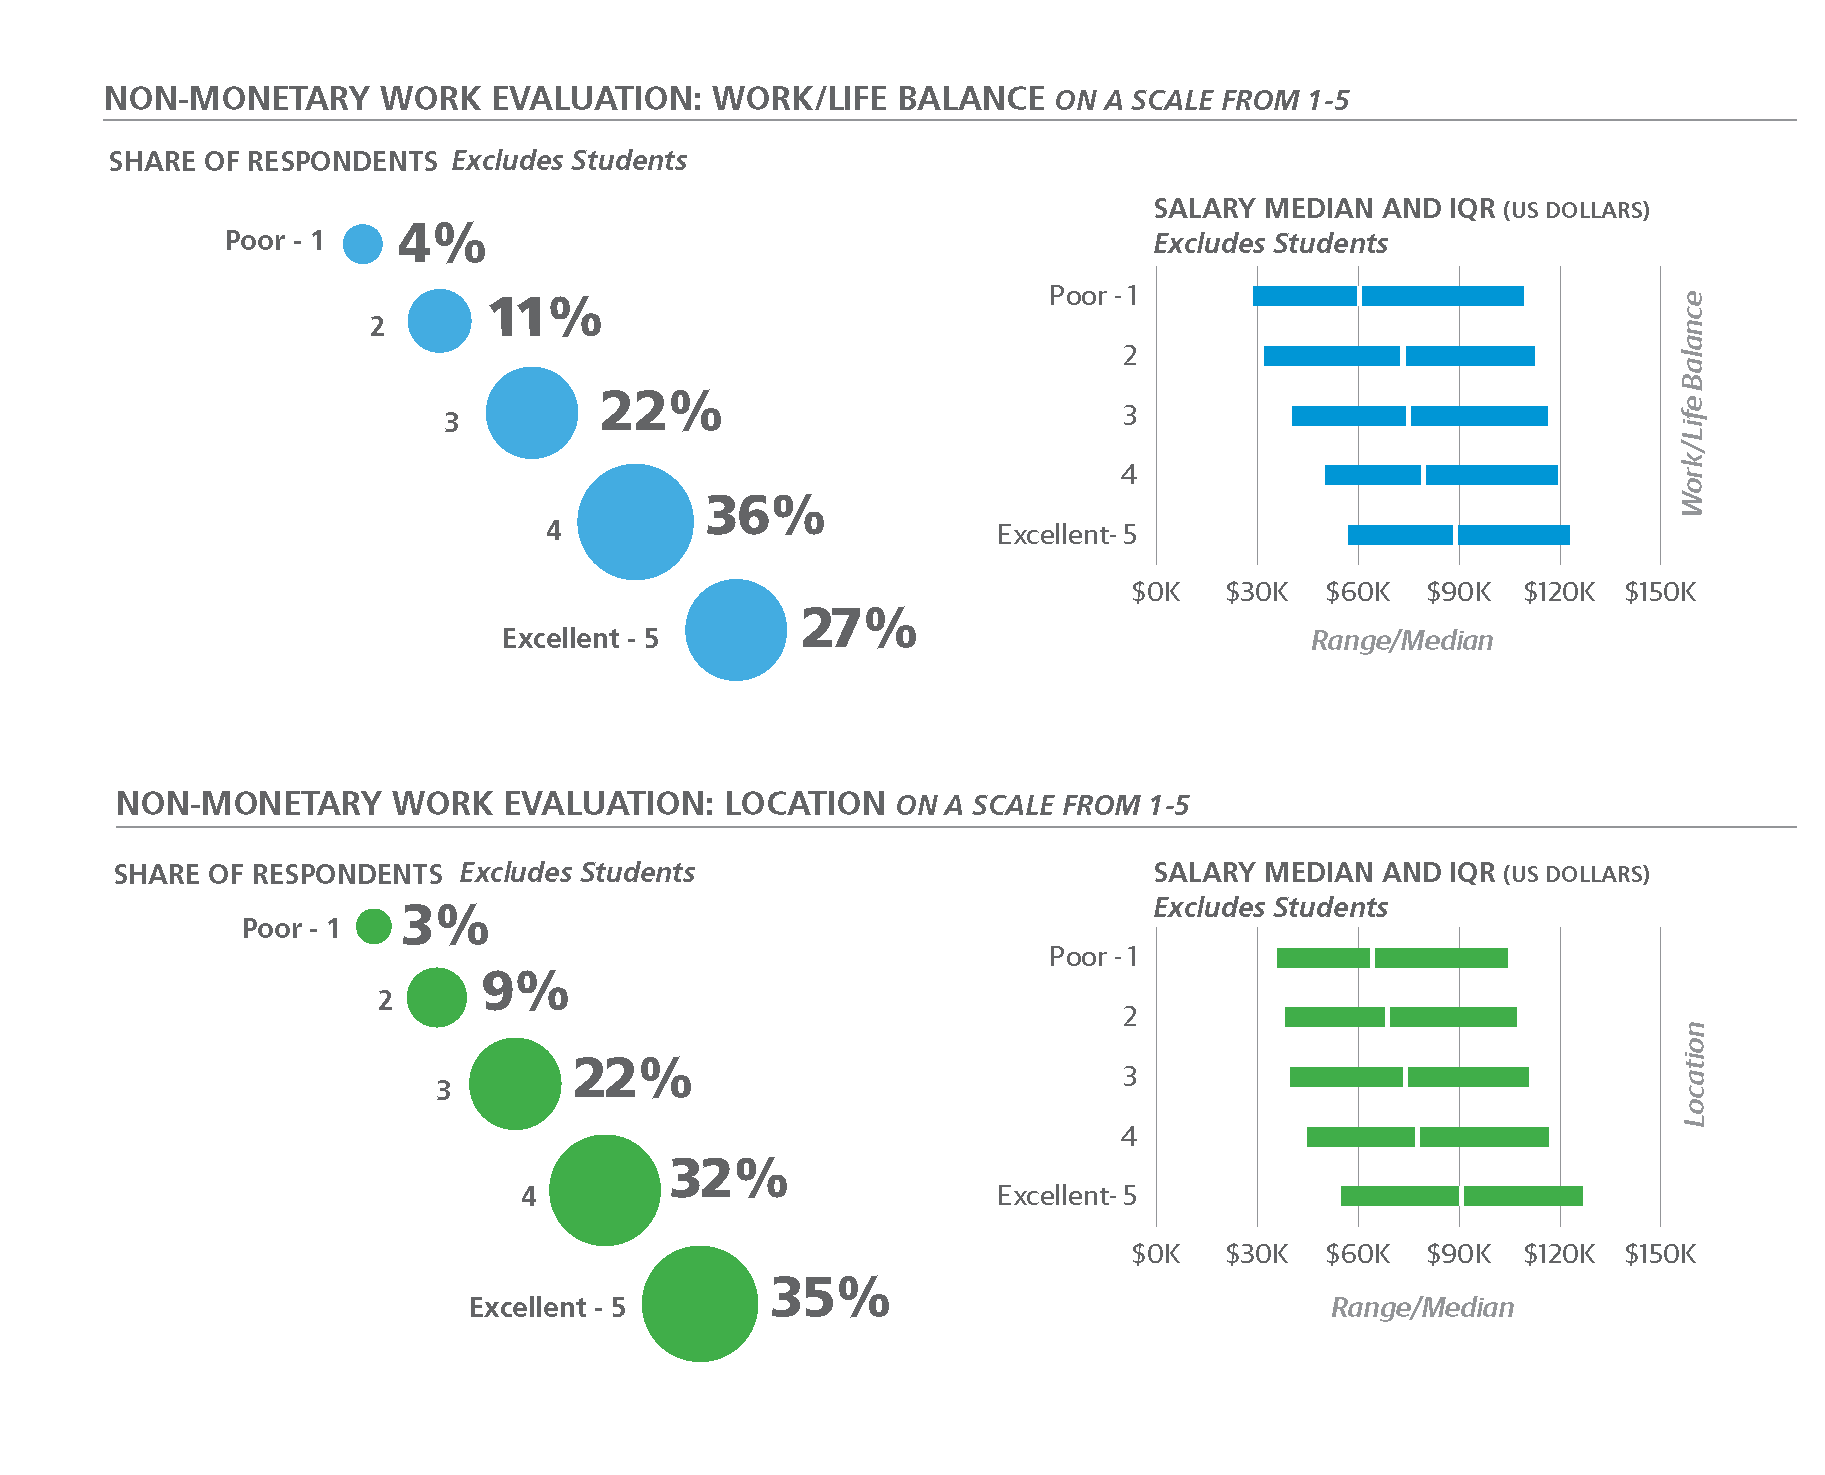
When it comes to work/life balance, 22% of the respondents
were neutral (3), whereas 63% see themselves as having a
positive work/life balance (4 or 5). Companies that allow for
good work/life balance also tend to offer better salaries. The
median salary of those who think their work/life balance is
poor (1) was $60K, whereas those who rated their work/life
balance as excellent (5) had a median salary of $91K.
67% of the respondents feel positive about the location of
their current roles (4 or 5). This might be a self-fulling system:
if a company’s location is too far away from home or the
work environment is not good, it’s unlikely that employees
will work there for long. By taking a job at a company with
a better location, you’d naturally rate it higher. So it makes
sense that this data point would be positive simply because people will self-correct away from being negative. There’s a
small trend in salaries increasing with location satisfaction.
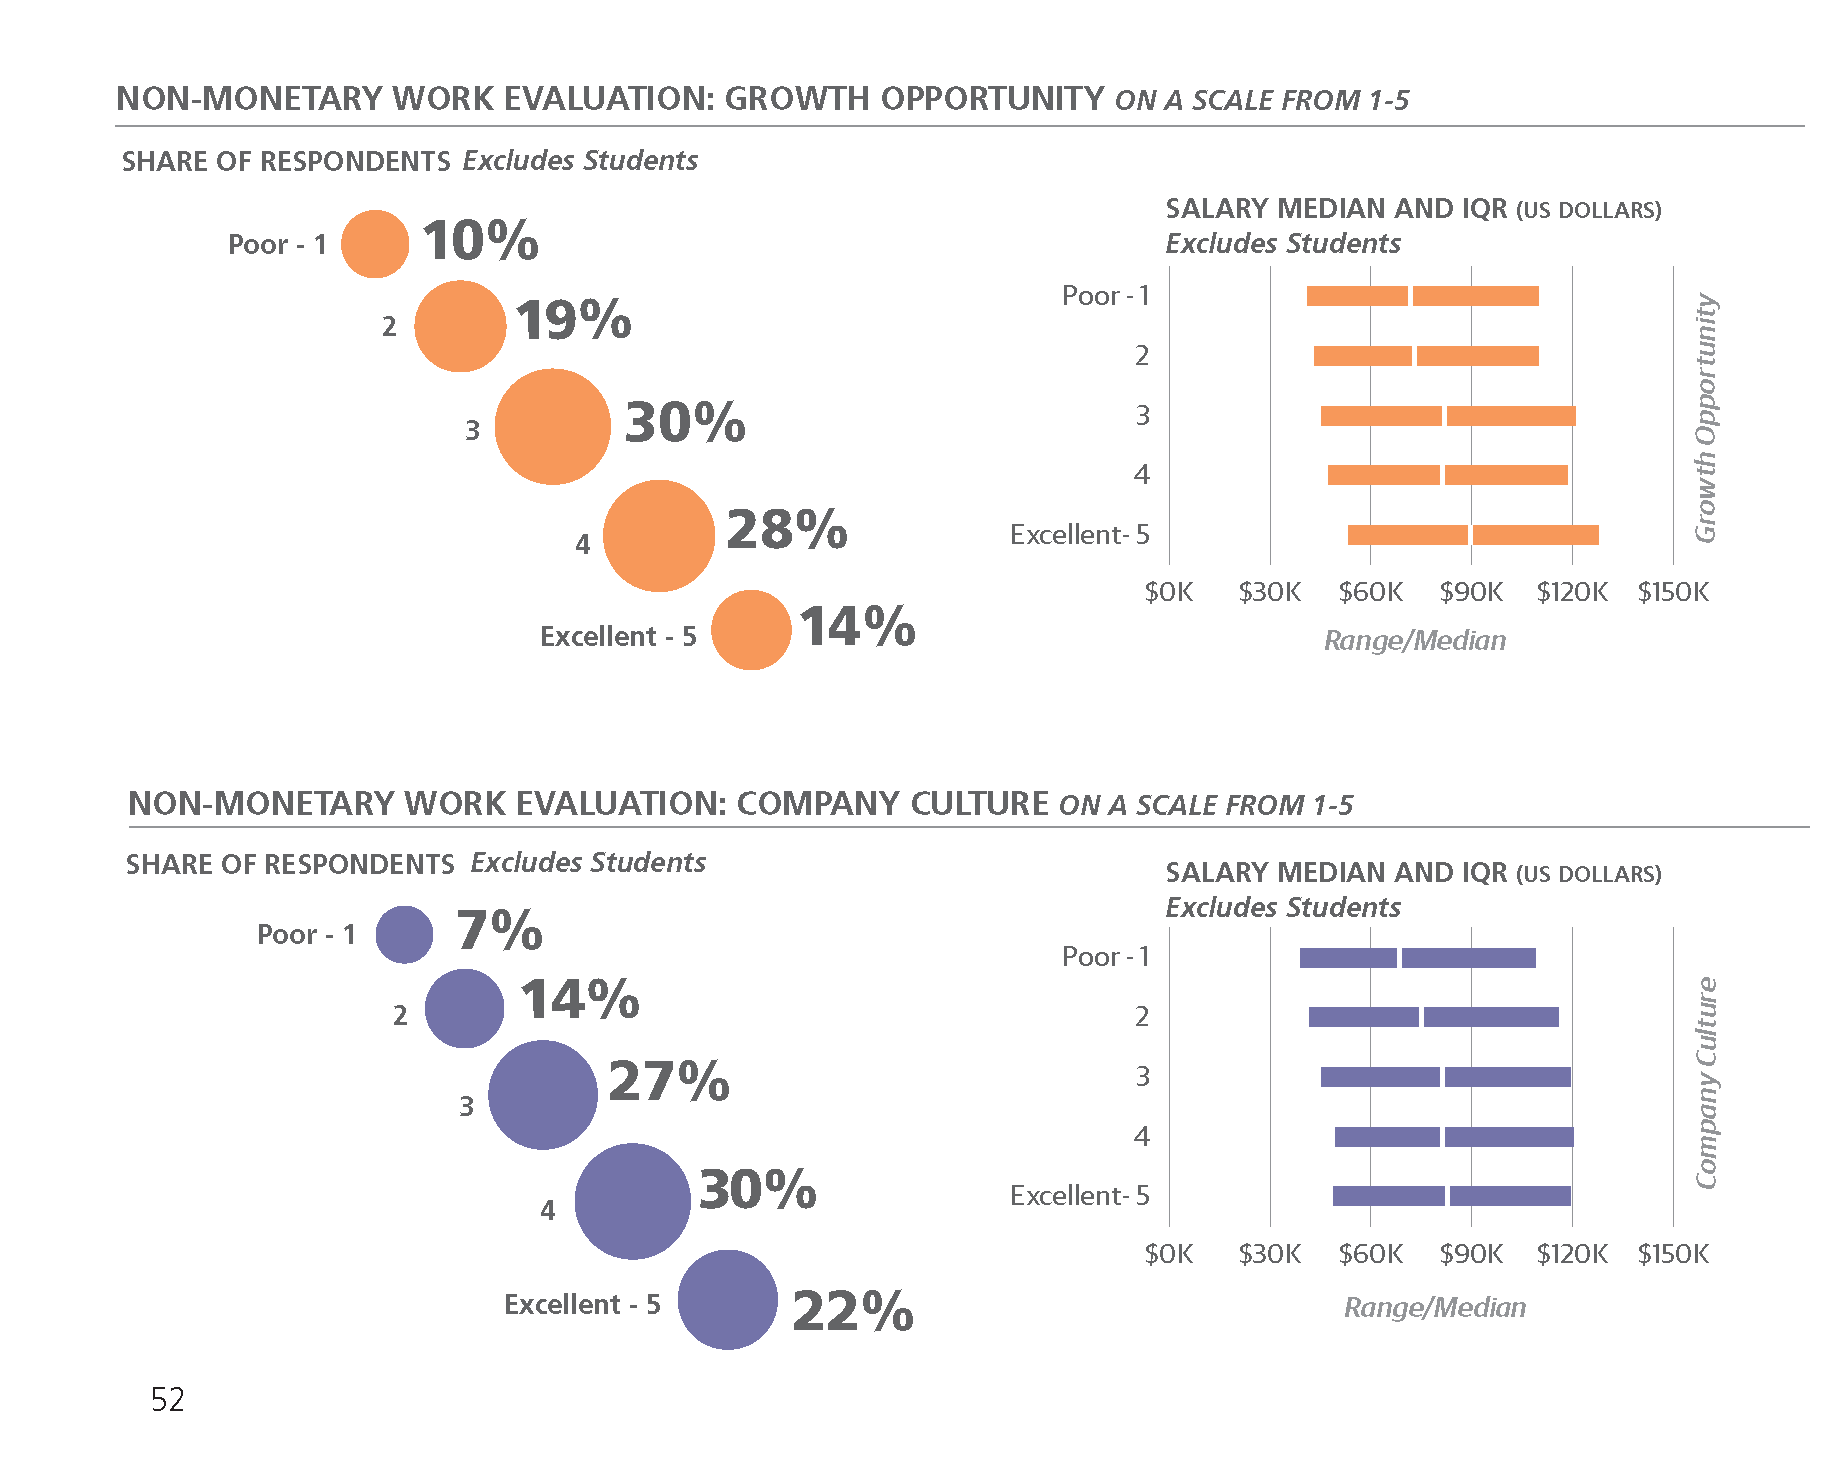
30% of the respondents were neutral (3) about their opportunities
for growth. Their median salary was around $82K,
slightly higher than the overall median salary of $80K for all
respondents. 42% of the respondents have a positive view
toward growth opportunities (4 or 5). They have salaries ranging
from $81K to $90K.
There is a $28K difference in median salaries between those
who rated their growth opportunities as poor (1)—10% of
respondents at $72K—and those who rated them excellent
(5)—14% at $90K.
Salaries also increased with better company culture. The
median salary difference between respondents who chose the
lowest rating (1) and those who chose the highest rating (5) is
$15K. In general, respondents were happy with their company
culture: only 20% rated it negatively (1 or 2), whereas 52%
had positive views of it (4 or 5).
It certainly does seem that you can have your cake and eat it
too. Companies who respect their employees both pay them
well and create a positive place to work. Maybe companies
realize that getting and keeping great talent is expensive, but
cheaper than constantly trying to find new talent.
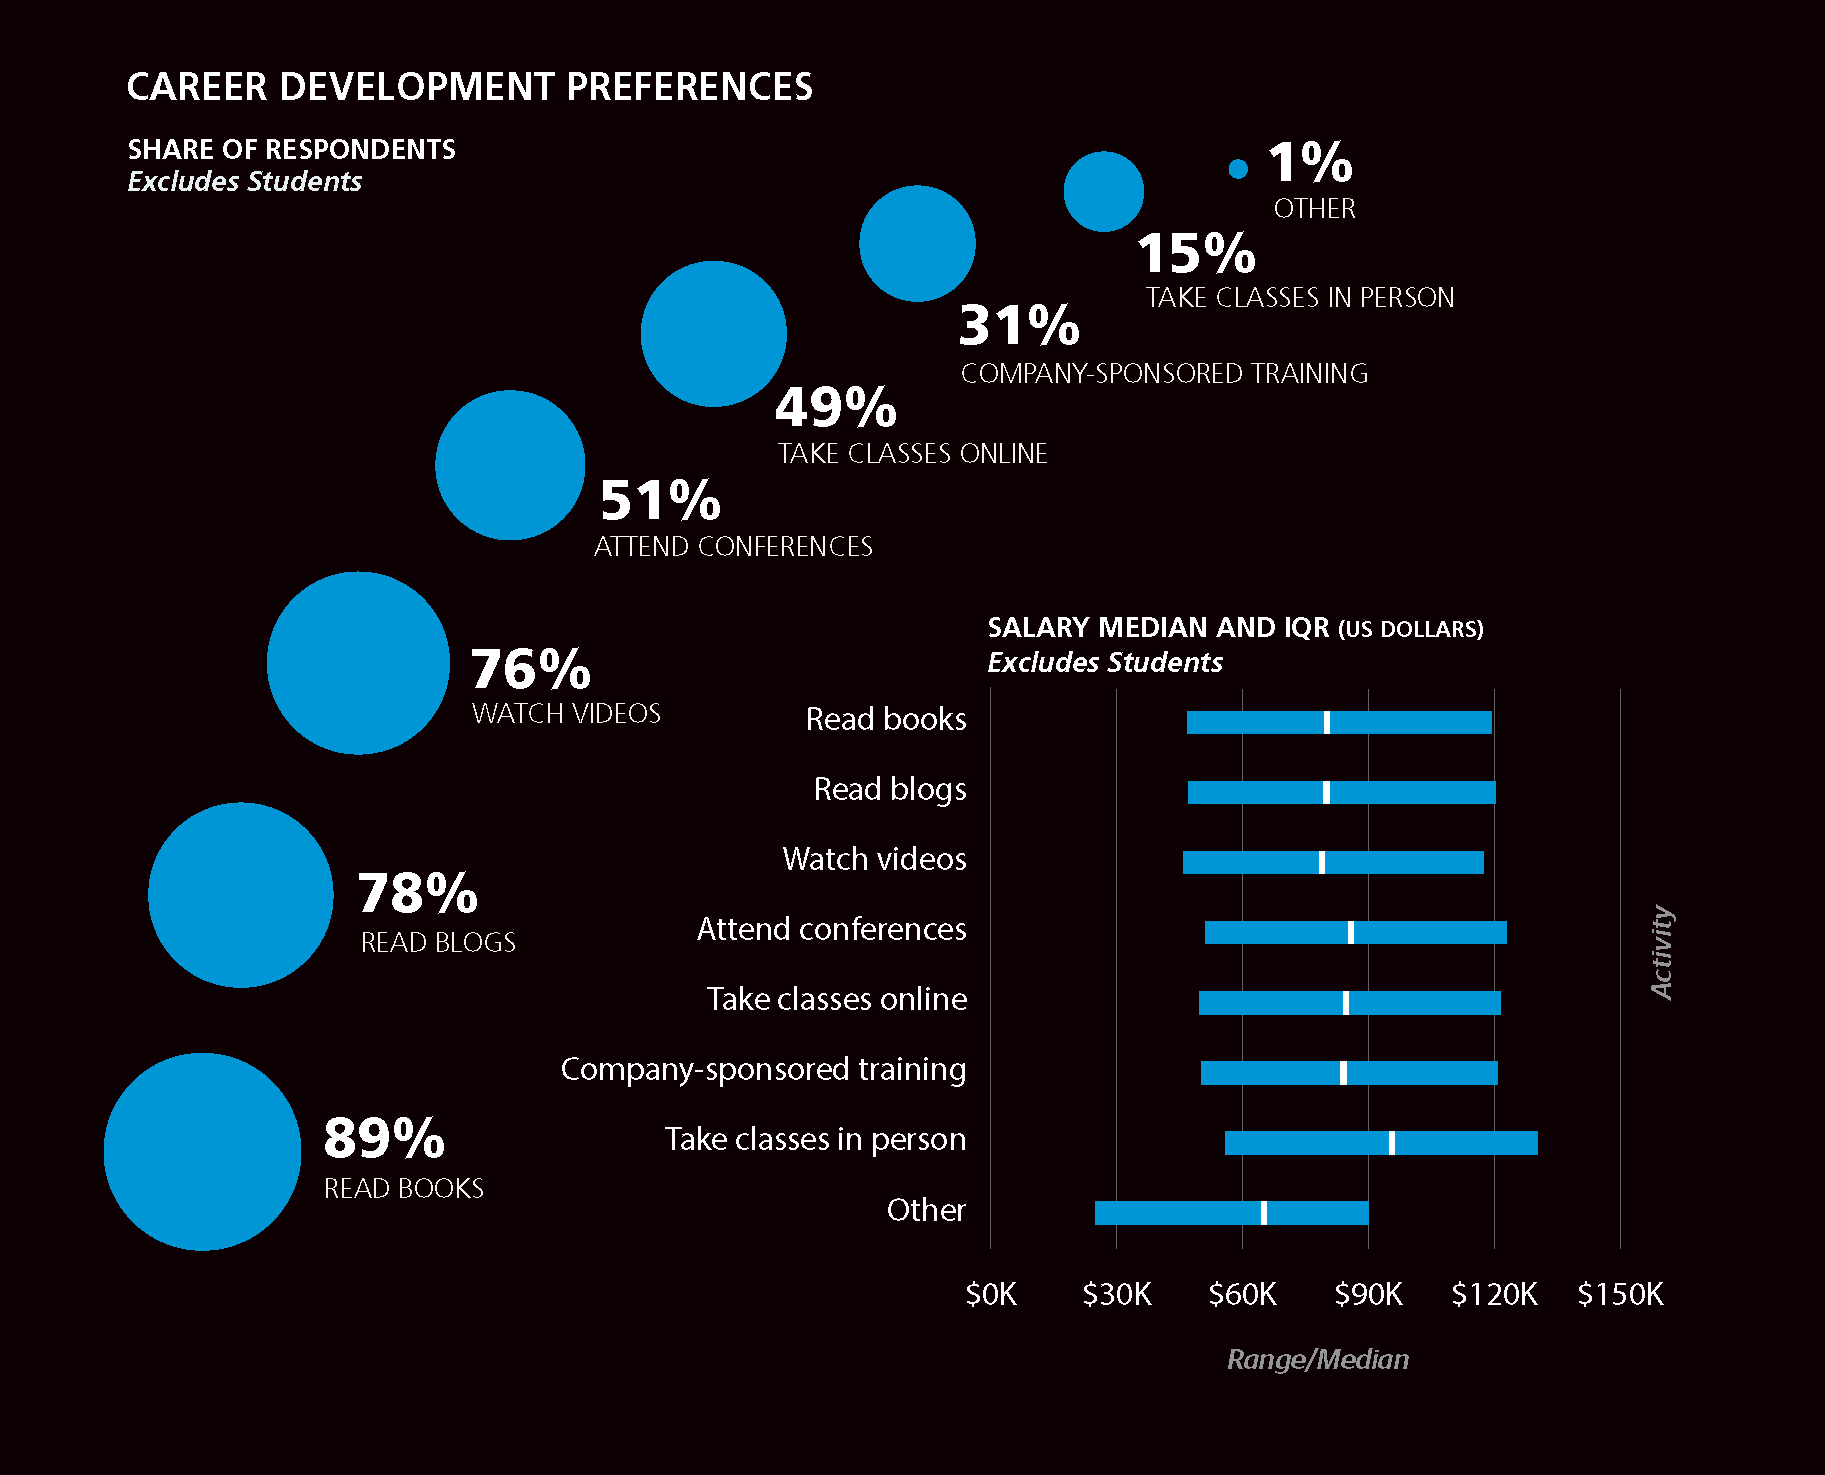
Career Development Preferences
THE SURVEY ASKED RESPONDENTS IF THEY ENGAGED
IN ANY SPECIFIC CAREER-DEVELOPMENT ACTIVITIES:
reading books and blogs, watching videos, taking online classes,
and attending conferences.
It turns out that none of these activities affected salary in
any substantial way. The median salary was around $80K for
the respondents in each of the preferred career-development
options. The only two exceptions were “None of the above,”
which had a detrimental effect on salaries, dropping them to
$65K, and “Taking Classes in-person,” which raised the median
salary to $95K.
While the salaries might be similar for the different activities,
what activities are chosen varies greatly. The most popular was
reading books (89%), followed by reading blogs (78%). O’Reilly
Media sells a lot of books, so it isn’t a surprise that reading
is high on the list, but O’Reilly also hosts conferences across many different disciplines. About half of our respondents said
they attend conferences as a way to improve their careers.
Roughly the same amount said they take online classes,
whereas about 3 out of 4 respondents said they use videos as
a source of information.
Lower down the preferred list are company-sponsored trainings
(31%) and in-person classes (15%). Respondents who
prefer to take in-person classes tended to have a higher median
salary (around $95K) than any of the other career-development
options. This probably has less to do with the classes
themselves and more to do with these people’s positions
within their companies. Taking time off to attend conferences—
or finding the time to watch videos, read books, and
read blogs—can be difficult with a busy schedule, so being
instructed to attend an in-person class might be the most
viable option.
The Model in Full
THE MODEL HAS R2 OF 0.587: this means the model
explains approximately 59% of the variation in the sample
salaries. The intercept has been combined with the geographical
coefficients, of which you select one. You then
proceed through the coefficients, adding or subtracting the
ones associated with a feature that applies to you. Once
you sum up the coefficients, you will obtain the model’s
estimate for your annual total salary in US dollars.
GEOGRAPHY:
- Australia/NZ: +$65,334
- Canada: +$54,658
- Western Europe: +$40,831
- Asia: +$27,094
- Latin America: +$15,860
- Africa: +$13,058
- Eastern Europe: +$11,511
- US California: +$113,507
- US Mid Atlantic: +$92,467
- US Texas: +$84,910
- US Southwest/Mountain: +$84,211
- US South: +$79,422
- US Midwest: +$76,327
EXPERIENCE:
- Experience, per year: +$1,384
EDUCATION:
- Master’s degree: +$5,940
- PhD (in addition to Master’s): +$22,014
GENDER:
- Female: –$6,120
TITLE:
- VP/Director: +$31,204
- C-Level: +$20,429
- Engineering manager: +$19,918
- Architect/Technical lead: +$14,287
- Data scientist/analyst: –$8,693
INDUSTRY:
- Search/Social networking: +$16,454
- Banking/Finance: +$12,780
- Government: –$10,323
- Nonprofit/Trade Association: –$12,156
- Education: –$18,459
Conclusion
THIS SECOND ANNUAL SOFTWARE DEVELOPER SALARY
SURVEY garnered over 6,800 responses this year, up from
5,000 responses in 2016. While we did see a drop in median
salaries compared to last year, we also noted big changes in
the demographics of the respondents that may help explain
those declines. However, many of the trends and percentage
shares we observed last year held this year, giving us confidence
in the stability of the survey as a measurement tool.
The software development survey is an open, self-selecting
survey. Respondents may not be representative of the industry
as a whole, likely reflecting the inherent biases of those familiar
with O’Reilly and engaged in some way with the content
and events that O’Reilly produces. Keep that bias in mind
when reviewing the results. If the survey results have little in
common with your own work/life experience, it’s more likely
that the survey did not capture your situation rather than your
situation being abnormal.
When looking at the charts, tables, and results, remember the
data is all interconnected. Try not to focus on or optimize for
any one attribute. If C++ programmers make a higher salary
than others, simply learning that language is unlikely to lead to higher pay. The C++ programmers in the survey may have
more experience, work for larger companies, have higher
degrees, or work in a different industry than you do. Use the
survey results as a starting point for thinking about your own
career and what path (i.e., what skills, locations, roles, and responsibilities)
might work best for your goals and aspirations.
Also, keep in mind that causation doesn’t mean correlation.
For example, attending more meetings, while correlated with
higher pay, is not likely to increase your salary. Focus instead
on gaining the responsibilities and roles associated with those
who attend more meetings to advance. This goes for everything
in the survey, programming languages, company size,
industry, and so on.
The survey aims to provide information you can use to make
well-informed decisions regarding your career by helping you
better understand your own situation in the context of the
larger software development community. You can address
what you find most important to you, including tool choices,
work methods, culture, and compensation. We hope
the perspectives offered by the survey can assist you in such
endeavors.