The big data ecosystem for science
A look at the data pipeline architecture for five key NERSC projects.
 Pipe grid. (source: Pixabay)
Large-scale data management is essential for experimental science and has been for many years. Telescopes, particle accelerators and detectors, and gene sequencers, for example, generate hundreds of petabytes of data that must be processed to extract secrets and patterns in life and in the universe.
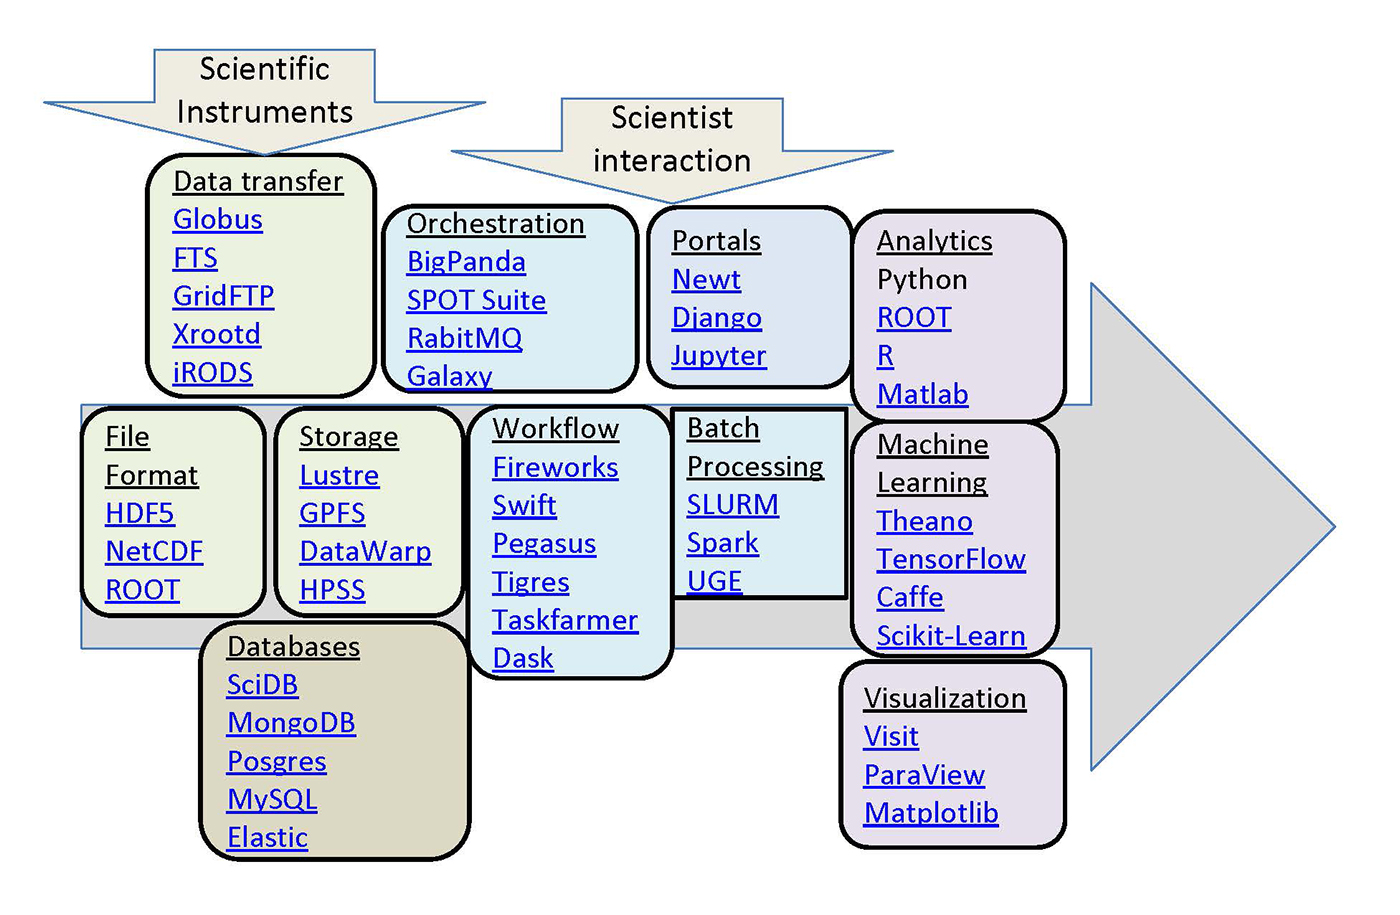
The data technologies used in these various science communities often predate those in the rapidly growing industry big data world, and, in many cases, continue to develop independently, occupying a parallel big data ecosystem for science (see Figure 1). This post highlights some of these technologies, focusing on those used by several projects supported by the National Energy Research Scientific Computing Centre (NERSC).

Learn faster. Dig deeper. See farther.
Across these projects we see a common theme: data volumes are growing, and there is an increasing need for tools that can effectively store and process data at such a scale. In some cases, the projects could benefit from big data technologies being developed in industry, and in some other projects, the research itself will lead to new capabilities.
Particle physics and the Large Hadron Collider
Introduction
The Large Hadron Collider (LHC) at the European Organization for Nuclear Research (CERN) in Geneva is the world’s largest scientific instrument, designed to collide protons at the highest energies ever achieved. The resulting spray of particles is observed in detectors the size of buildings, in an attempt to discover one-in-a-billion events that have the potential to uncover new fundamental particles and, ultimately, secrets of the universe. The extreme rate of data produced, together with the overall volume of data and the rarity of interesting events, has made the research with the LHC one of the original examples of big data. LHC experiments require smart data ingestion, efficient data storage formats that allow for fast extraction of relevant data, powerful tools for transfer to collaborators around the world, and sophisticated statistical analysis.
Data ingestion
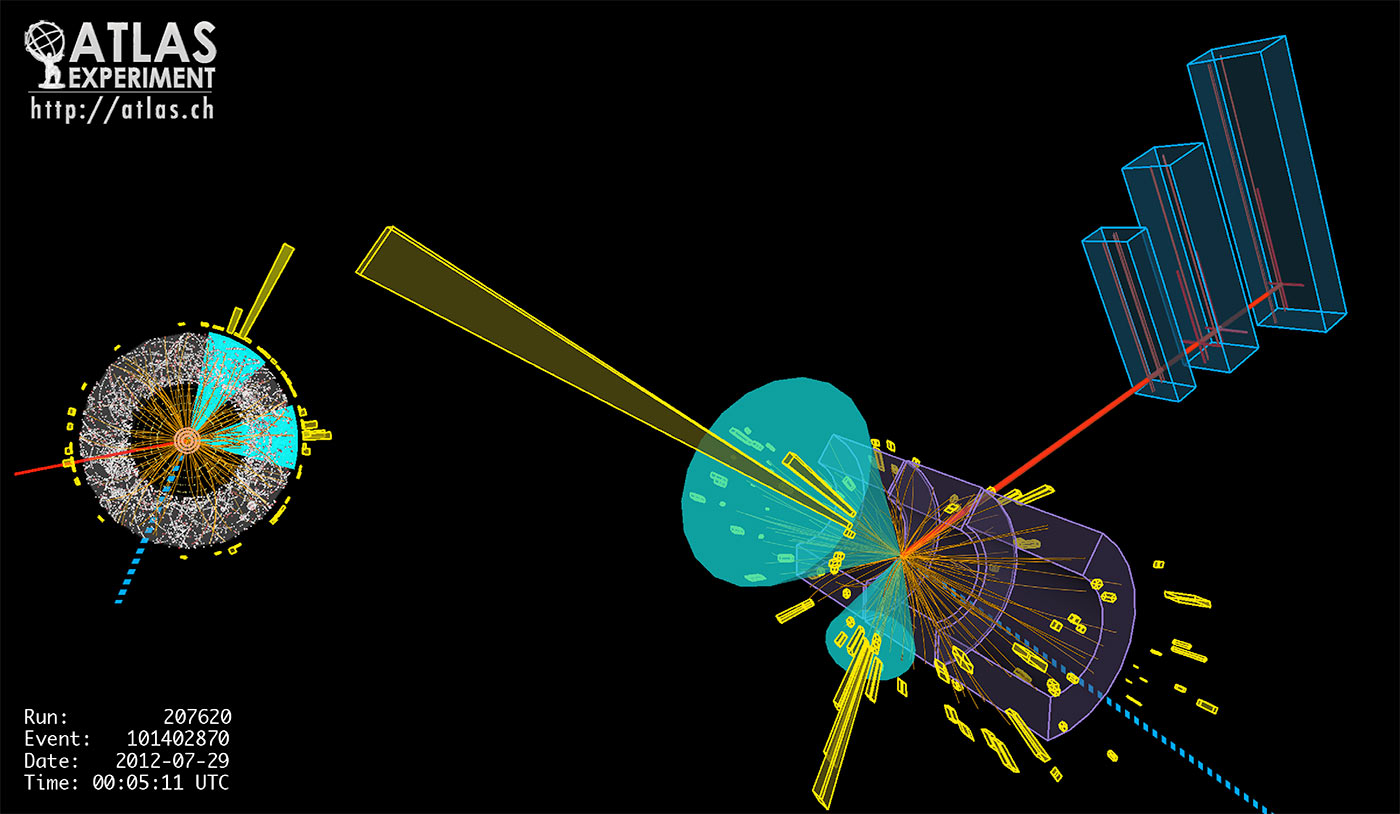
The LHC enables protons to collide 40 million times per second in detectors packed with instruments that take hundreds of millions of measurements during each collision (Figure 2). The only way to deal with the resulting petabyte-per-second data ingest rate is to have multiple levels of data analysis with the first level, the trigger, running on dedicated hardware at the detector, and the “online” data pipelines running custom analysis software on bespoke data formats for maximum performance. Most initial data is discarded, but around 100 PB per year of raw data is stored for further, more interactive, analysis by physicists at computing centers like NERSC.
Data storage
The particle physics community was one of the first to deal with storing and querying large amounts of data, introducing the world’s first petabyte-sized database in 2005 with the BaBar experiment. Around that time, due partly to limitations found by BaBar, researchers at the LHC decided to predominantly make use of the file-based format ROOT (closely related to the dominant analytics framework described below). ROOT offers a self-describing binary file format with huge flexibility for serialization of complex objects and column-wise data access. Today, hundreds of petabytes of data worldwide is stored in this way.
Data transfer and access
Physics at the LHC involves collaborations of thousands of physicists at hundreds of institutions from dozens of countries. Similarly, computing for the LHC involves hundreds of thousands of computers at hundreds of sites across the world, all combined via grid computing (a precursor to Cloud technology). Widespread resources also mean considerable movement of data—totaling several petabytes per week and requiring tools like the File Transfer Service (FTS). Another more recent development in this community has been to build data federations, based on, for example, the XrootD data access protocol, which allow all of this data to be accessed in a single global namespace and served up in a mechanism that is both fault-tolerant and high-performance.
Data processing and analysis
To coordinate this transfer and access of data across the world, physicists have built data management tools such as Big PanDA to run analyses that allow thousands of collaborators to run hundreds of thousands of processing steps on exabytes of data as well as monitor and catalog that activity. For the analyses themselves, the rare signals under investigation require sophisticated data analysis and statistics, a discipline that also has a long history in the scientific community (the CERN Program Library was one of the first open source scientific statistical software libraries). Once again, the particle physics community has developed its own similar tools primarily through the ROOT framework, which provides visualization and plugins for machine learning, rather than using alternatives common in the wider data science community, such as R or Python’s scikit-learn.
The future
By 2020, collisions in the high-luminosity LHC will be 10 times more intense than those in the current LHC. This will mean initial streaming data analysis on orders of magnitude more data and shipping the resulting 400 PB of data per year across the world. Managing this extreme data challenge will require the community to build new tools, on the best of their own and others’ technologies.
Primary Collaborator: Wahid Bhimji (LBNL)
Cosmology and astronomical image surveys
Introduction
Cosmologists require big data solutions to answer the big questions they ask about the nature of the universe — what is it made of, and how old is it? The theoretical side of cosmology involves running large simulations of the universe—a traditional high-performance computing problem. But analyzing the output of those simulations is a data problem. Modern experiments that simulate large volumes of the universe can output terabytes of data at each step of the simulation, resulting in petabyte-scale simulated data sets. In addition, to be able to understand how these simulations relate to our universe, we need to compare the outputs of those simulations to real data collected by the telescopes that take images of the night sky. Processing the nightly output of terabytes of image data from astronomical surveys (such as the Dark Energy Survey) and analyzing the resulting measurements of billions of stars and galaxies is a data challenge in itself.
Data ingestion and storage
Large volumes of data are created in cosmological simulations—as time passes in the theoretical universe, snapshots are taken to characterize the distribution of matter at discrete timesteps. These snapshots need to be processed to look more like the observations we make from Earth: galaxies need to be added appropriately, light paths calculated, and statistics calculated from the resulting simulated observations. This is most easily done using an in-situ analysis, where the processing of the simulation data is done at the same time (and inside the same supercomputer) as the simulation itself. The resulting reduced output may range in the tens of terabytes rather than a petabyte of raw simulation data, which is more easily shared between research sites. Data is usually stored in a custom binary format, but increasingly, cosmologists are taking advantage of the parallel input/output (I/O) capabilities offered by the HDF5 format to enable more efficient processing of simulation output. There are effectively no standard tools for ingesting this data—each group uses its own formats and methods, which poses a challenge for the community.
Data transfer and access
Astronomy has always dealt with the problem of data movement: images of the sky taken with telescopes (often in remote locations) need to be transferred to a scientist’s home institution. In the past, this may have been done physically, using a photographic plate or a hard drive of data, but today, large volumes of image data are transferred around the world electronically. However, the issue of data movement and access do not end with simply shipping the data to a host datacenter. Today’s large-scale imaging surveys provide data to collaborations of hundreds of astronomers and cosmologists, and potentially hundreds of thousands of members of the public. (See the Sloan Digital Sky Survey for one of the most successful examples of a publically available astronomical data set.) These images, and measurements of the stars and galaxies detected in them, are typically hosted on a data portal by a single institution. Challenges remain for how to serve up future petabyte-scale data sets to both scientists and the public.
Cosmological simulations also face data access issues. A recent effort demonstrated how to orchestrate cosmological simulations across multiple sites and serve the data to collaborators around the world. The Portal for Data Analysis Services for Cosmological Simulations (PDACS) provides access to shared repositories for data sets, analytical tools, cosmological workflows, and the infrastructure required to perform a wide variety of analyses on different compute facilities. This was demonstrated at the Department of Energy’s SC14 conference using data from the Dark Energy Survey. The data pipeline consisted of Docker containers encapsulating different stages of the analysis code that could be pushed out from the data host (the National Center for Supercomputing Applications, or NCSA) to Department of Energy supercomputers at Berkeley, Argonne, Brookhaven, and Oak Ridge national labs. The analysis code could be fired up on the various systems, which automatically transferred the data they needed for processing. The results were then pushed back to NCSA over ESnet.
Data processing and analysis
Astronomers and cosmologists have long relied on image-processing software like Source Extractor to remove noise from images generated by telescopes and to detect astronomical objects (such as stars and galaxies) in the pixel data. However, it is difficult to spot many interesting features of this image data using simple peak-detection algorithms, and astronomers are increasingly turning to more sophisticated methods to identify and measure properties of astronomical objects. One of the most interesting recent developments in pattern recognition in astronomy has been crowd-sourcing measurements of complex image data that algorithms struggle to interpret. For example, galaxy morphology (i.e., whether a galaxy is a spiral, elliptical, or irregular) can be more easily determined by the human eye than simplistic algorithms, but it is impossible for professional astronomers to examine every one of the millions of galaxy images captured in today’s astronomical sky surveys. The Galaxy Zoo project, which started in 2007 and has more than 150,000 participants, has resulted in the human-led identification of new classes of astronomical objects—features that would otherwise be impossible for a machine to label—and has, in turn, influenced the next generation of machine learning techniques. This set of crowd-identified features has provided a training data set for machine learning methods (see Kaggle challenge).
Another example of modern analysis on astronomical data is the identification of gravitational lenses, as done in the Space Warps project. These distorted images of galaxies (Figure 3) are hard to identify with traditional image-processing techniques, but the identification of lensed images by human volunteers has provided valuable input to developers of pattern-recognition algorithms.
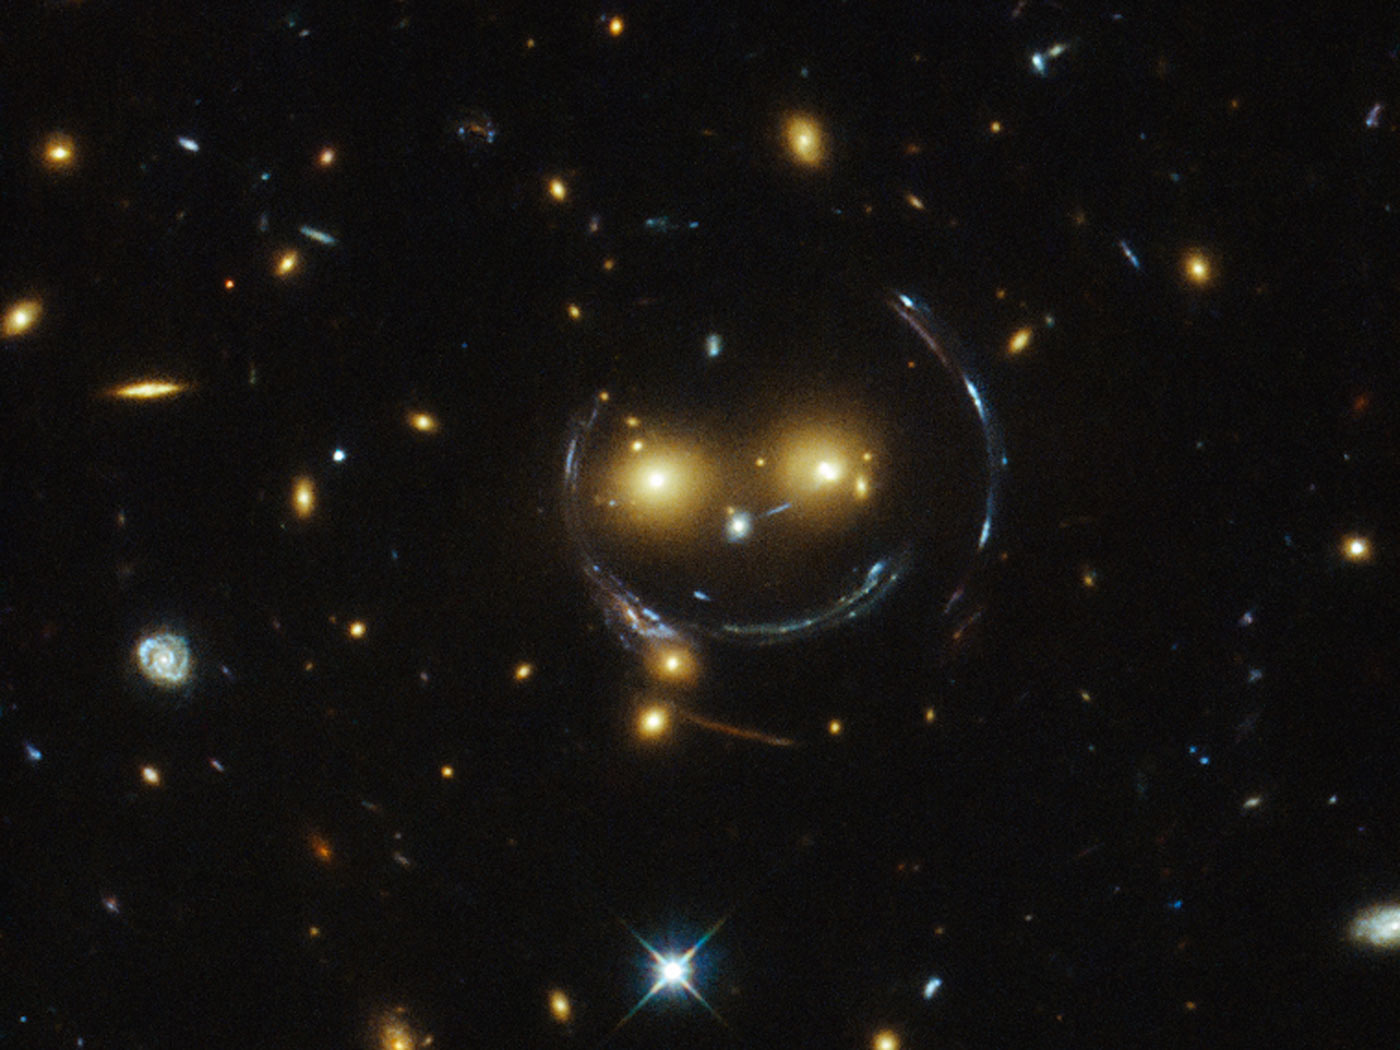
The future
The forthcoming Large Synoptic Survey Telescope (LSST) will change the way astronomers handle data. It will produce 15 TB per night of imaging data, which must be processed to produce alerts for exciting transient events (like evidence of a supernova explosion, or a moving object like an asteroid) within 60 seconds. The LSST Data Management stack is being developed to process this data quickly and efficiently as it comes off the telescope in Chile and transfer it to a central facility in the United States, where it will be further analyzed and made available to scientists. The measured properties of the stars and galaxies observed by LSST will be stored in Qserv, a custom distributed database query system that can scale to handle the trillions of rows and petabytes of data that will be generated. The LSST Data Management stack consists of three layers: an underlying infrastructure layer containing the system, storage, networking, and computing software; a middleware layer consisting of software for distributed computing, data access, and user interface; and an applications layer containing the data analysis software and data archives. It is based on Python with C++, used for computationally intensive tasks, and comprises more than 60 packages managed by Extended Unix Product System (EUPS).
Primary collaborator: Debbie Bard (LBNL)
Genomics and DNA sequencers
Introduction
The field of genomics has undergone a revolution over the past decade as the cost of sequencing has rapidly declined and the practice of sequencing has been commoditized. These advances are enabling discoveries in all areas of biology and have broad applications in cancer research, personalized medicine, bio-energy, and genetic engineering, just to name a few. The field of genomics is too broad to quickly capture the range of inquiry and discovery that is being enabled, but I will briefly describe some of the relevant technologies and analysis patterns below.
Data ingestion
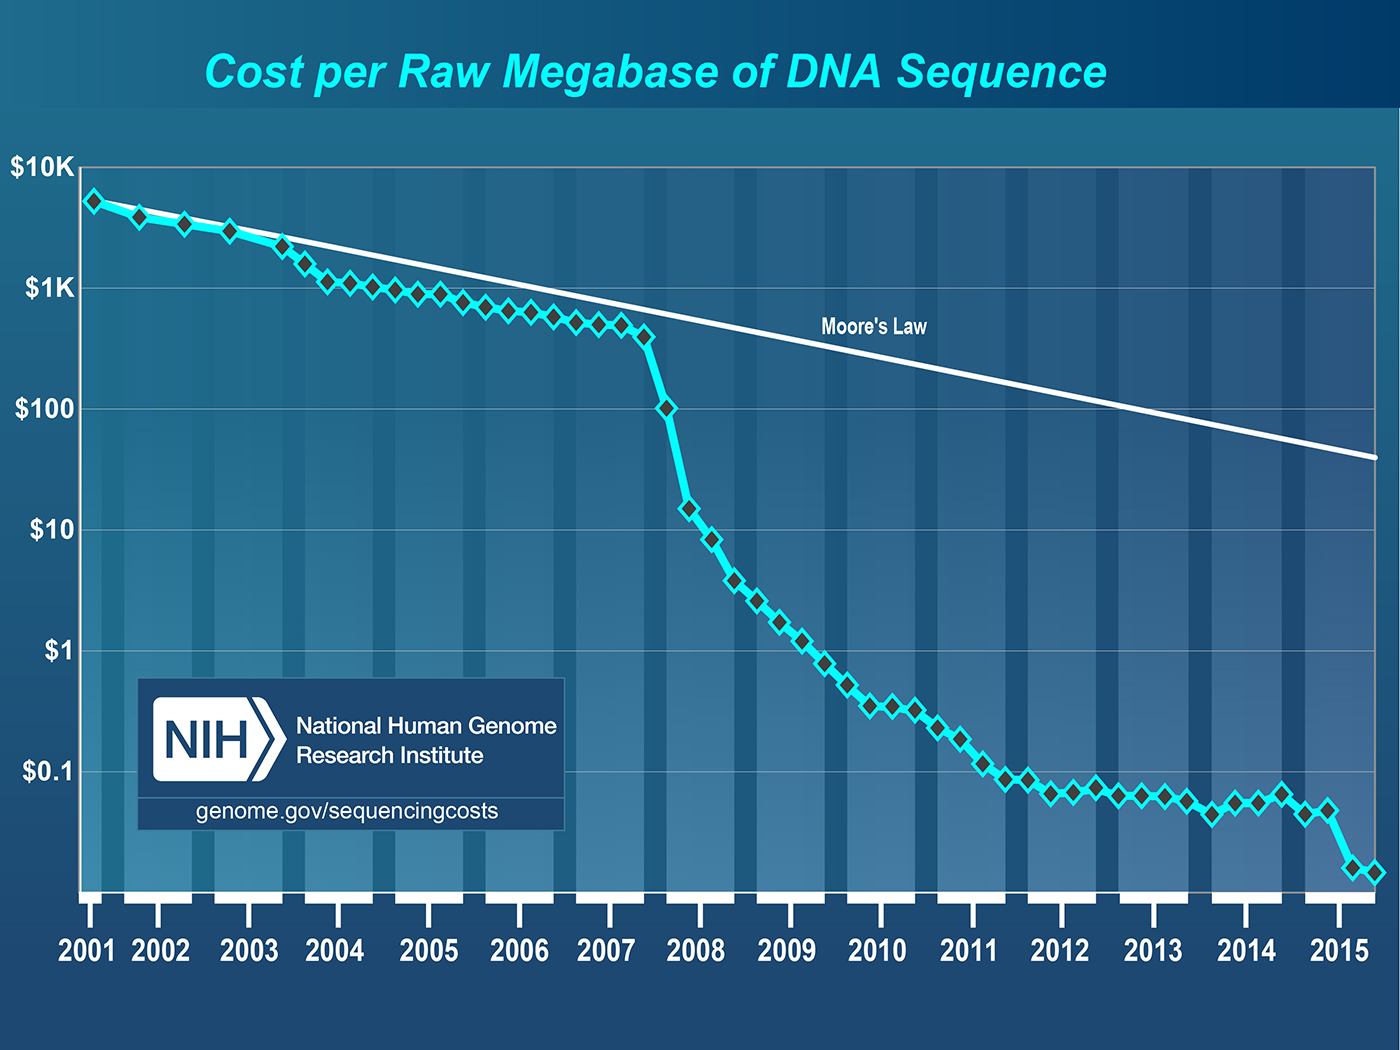
One of the leading sources of data in the genomic space is a sequencer that can extract the DNA sequence from a physical sample. These sequencers can then generate files, typically called “reads,” with the genetic code, along with information about the errors in those measurements. Sequencing costs have dropped by more than five orders of magnitude in a roughly 10-year period (see Figure 4). This dramatic improvement has been primarily enabled by “short-read” sequencing technologies that generate billions of reads in a single run, and are typically hundreds of base pairs in length. In contrast, single-molecule-based technologies provide longer reads, but typically have lower throughput. These technologies can be used to sequence DNA to understand the basic “code” of an organism, but short-read sequencers are increasingly being used to measure protein expression, variation, environmental response, and so on.
Data storage
The direct product of DNA sequencing is typically “reads” files, such as FASTA or FASTQ. These files can range in size from kilobytes to terabytes and capture a sequence ID; the sequence itself; and, potentially, error measurements. The smaller file sizes typically correspond to smaller, simple organisms such as microbes or viruses, and the larger file sizes come from complex organisms such as plants and animals or samples that include communities of organisms (e.g., microbial communities from a human gut or from soil). However, the raw sequence data is just one small piece of the data being generated in genomics.
Once the data is analyzed, there are a variety of file formats (of varying size) that capture everything from the code and structure of a genome, annotations about the function and role of the genes, variations of an individual compared to a reference (e.g., healthy cells versus cancerous cells), metabolic models, and so on. Although the formats may be standardized, how data is encoded in the formats can vary significantly and can make it difficult to reliably interpret data from various sources. The scale of the data stored can vary from hundreds of gigabytes or terabytes for an individual investigator to petabytes for a major sequencing center. The I/O patterns in genomics often stress storage systems because many analysis pipelines can generate a large number of small files as well as nearly random access patterns. Accommodating these workloads remains an open challenge, and even new technologies like solid state storage are often not sufficient, especially at scale.
Data processing and analysis
Scientists use the data from sequencing instruments to answer a broad range of questions. Consequently, the types of processing and analyses vary greatly, depending on what is being sequenced and the questions being addressed. However, many genomics pipelines follow a common pattern: quality control and filtering, assembly or alignment against a reference, and annotation or comparative analysis. These steps may be followed by modeling, integrated analysis, or statistical analysis, depending on the fundamental questions being asked.
The scale and types of computational resources required to conduct these analyses also vary. Some analyses, such as assembly, cannot be easily partitioned and are typically run on single large-memory nodes. For example, some large assemblies are run on terabyte memory systems. Other analyses, such as annotation or comparative analysis, can easily be subdivided and run in an “embarrassingly” parallel manner across hundreds or thousands of compute cores (i.e., without communication between the tasks). Traditionally, this type of analysis has been conducted on large workstations or commodity clusters. However, the increasing scale is leading some researchers to explore large high-performance computing (HPC) platforms for their analyses. For example, HipMer is an assembler written in a high-performance parallel language that performs de novo assembly of complex eukaryotic genomes using more than 10,000 cores. Other applications have been ported to run on accelerators and integrated circuits known as field-programmable gate arrays to accelerate specific kernels. The challenge in making this transition from commodity clusters to high-performance platforms is the variety of applications that are used in many workflows and the rapid increase in demand.
Data transfer and access
The raw data or analysis product can be transferred or shared at various stages using a variety of methods. Many web-based tools exist for analysis and sharing, such as KBase, Galaxy, Illumina BaseSpace, and the National Center for Biotechnology Information (NCBI). Transfers are often done using simple web posting, but other methods such as FTP, Globus, and even commercial solutions such as those from Aspera are also commonly used. Many sequencing products are posted to repositories like those run by the NCBI. A large number of sites also exist to support specific domains, organisms, and applications. For example, there are sites that focus on fungi, pathogens, microbes, and even specific organisms like corn or the fruit fly.
The future
Genomic sequencing technologies continue to improve. For example, new single-molecule-based sequencers promise to allow sequencing to be done on a laptop in the field. Although sequencing costs are not declining as rapidly as in the past, they continue to decrease. Many fields are looking at how they can capitalize on these improvements to enable new applications—e.g., some precision medicine techniques aim to use sequencing data on a patient to customize therapies or detect changes in the body over time. However, these new techniques require innovations in the data space, particularly in storage and analysis methods.
Primary Collaborator: Shane Cannon (LBNL)
Climate science
Introduction
Climate change is one of the most pressing challenges for human society in the 21st century. Studying how the climate system has evolved over the latter half of the 20th century is largely enabled by a combination of conventional weather stations, ocean sensors, and global satellites. To better understand future climate regimes, we must turn to high-fidelity simulations. CAM5 (Community Atmospheric Model) is a state-of-the-art climate model that, when run at 25-km resolution for a simulated period of three decades, produces more than 100 TB of complex, multivariate data. The 2007 Nobel Peace Prize was awarded to the Intergovernmental Panel on Climate Change (IPCC), which analyzed terabytes of climate simulation data. Storing, managing, accessing, and analyzing such large data sets is key for summarizing global quantities (e.g., mean temperature, sea-level rise) as well as localized extremes (e.g., intensity and frequency of tropical cyclones). The scientific community, policy makers, and the broader public can use this information to understand implications of various emission scenarios and the impact on human society.
Data generation
Climate scientists routinely exercise complex, large-scale climate simulation codes (CAM, WRF, CESM, MPAS, etc.) in a highly parallel fashion on O (10,000) cores on high-performance computing systems (e.g., Edison and Cori at NERSC). These simulations can be configured to explore a broad range of scenarios (e.g., how will the Earth warm under a business-as-usual scenario versus broad adoption of carbon-emission-friendly technologies). A different class of codes are also run in “re-analysis” mode, which produces interpolate satellite and weather station data to produce global maps. International products (NCEP, ECMWF, 20CR, JRA–55, etc.) from various modeling centers are readily available for the research community. Perhaps the most elaborate set of simulations are conducted under the Coupled Model Intercomparison Project (CMIP). The CMIP Phase 5 (CMIP5) data set comprises more than 5 PB of data representing more than 25 climate models from various countries.
Data storage
The climate simulation community realized early on that subscribing to a common standard and storage format was key for sharing and disseminating the results of various codes. A common format also meant that a host of analytics capabilities could easily be applied to output and that the results of various modeling efforts could be readily compared. The climate community uses Network Common Data Form (NetCDF) for storing data. There are two popular variants: NetCDF-4 (which is layered on top of HDF5) and PnetCDF. NetCDF provides for relatively rich semantics; the community has adopted the climate and forecast (CF) metadata conventions for standardizing names of variables, dimensions, and attributes. Broad adoption of these standards has enabled the climate community to work coherently across boundaries of various funding agencies and nations. Large-scale, international projects like the IPCC partially owe their success to the adoption of NetCDF and CF conventions.
Data transfer and access
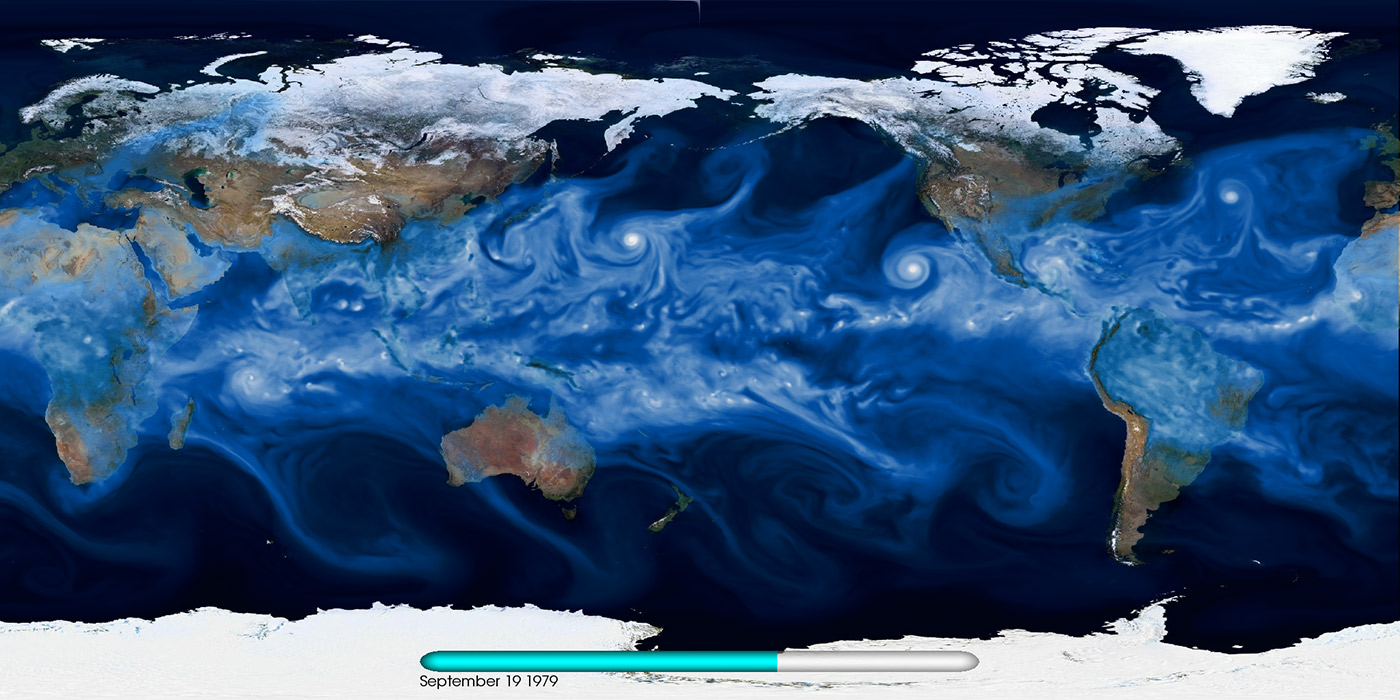
Currently, the Earth System Grid Federation (ESGF) is a de facto gateway for accessing CMIP5 data. Various modeling groups publish their results in conformance with the data standards required by ESGF. This drastically reduces the complexity of all downstream analysis: any researcher in the world can specify a model, time period, and variable of interest, then download and analyze the data sets on their local resource using the ESGF portal (see Figure 5).
Data processing and analysis
Processing tens of terabytes worth of multivariate climate simulation data presents unique challenges. Until recently, stand-alone serial codes like CDO, NCO, and CDAT have largely been used to compute spatial averages, trends, and summary statistics. Recent tools like TECA (Toolkit for Extreme Climate Analytics) have finally bridged the gap between HPC systems and large simulation data sets. It is now possible to detect extreme weather patterns on 10-TB-sized data sets in one hour. Historically, the climate data analytics community has been prescriptive about its definitions of patterns. As data volumes explode, it is inevitable that the community will leverage and adopt machine learning capabilities to automatically detect both patterns and anomalies in climate data. Preliminary work that demonstrates the effectiveness of deep learning in reproducing human-labeled extreme weather patterns lends credibility to this investigation.
The future
As we look toward the future of climate science within the Department of Energy, powerful petascale and exascale-class HPC systems will facilitate more accurate simulations of the global climate system. We will be able to improve spatial scales to permit cloud-resolving simulations, and the representations and coupling of various atmospheric, oceanic, and land processes will improve with time. With improvements in statistical methods, we will be able to better characterize various sources of uncertainty for the future. We expect such simulations to easily produce petabytes of data, which will radically increase the complexity of all stages in the data pipeline: storing, managing, moving, and accessing such large volumes will be a challenge.
Primary Collaborators: Prabhat, Eli Dart, Michael Wehner, and Dáithí Stone (LBNL)
X-ray crystallography
Introduction
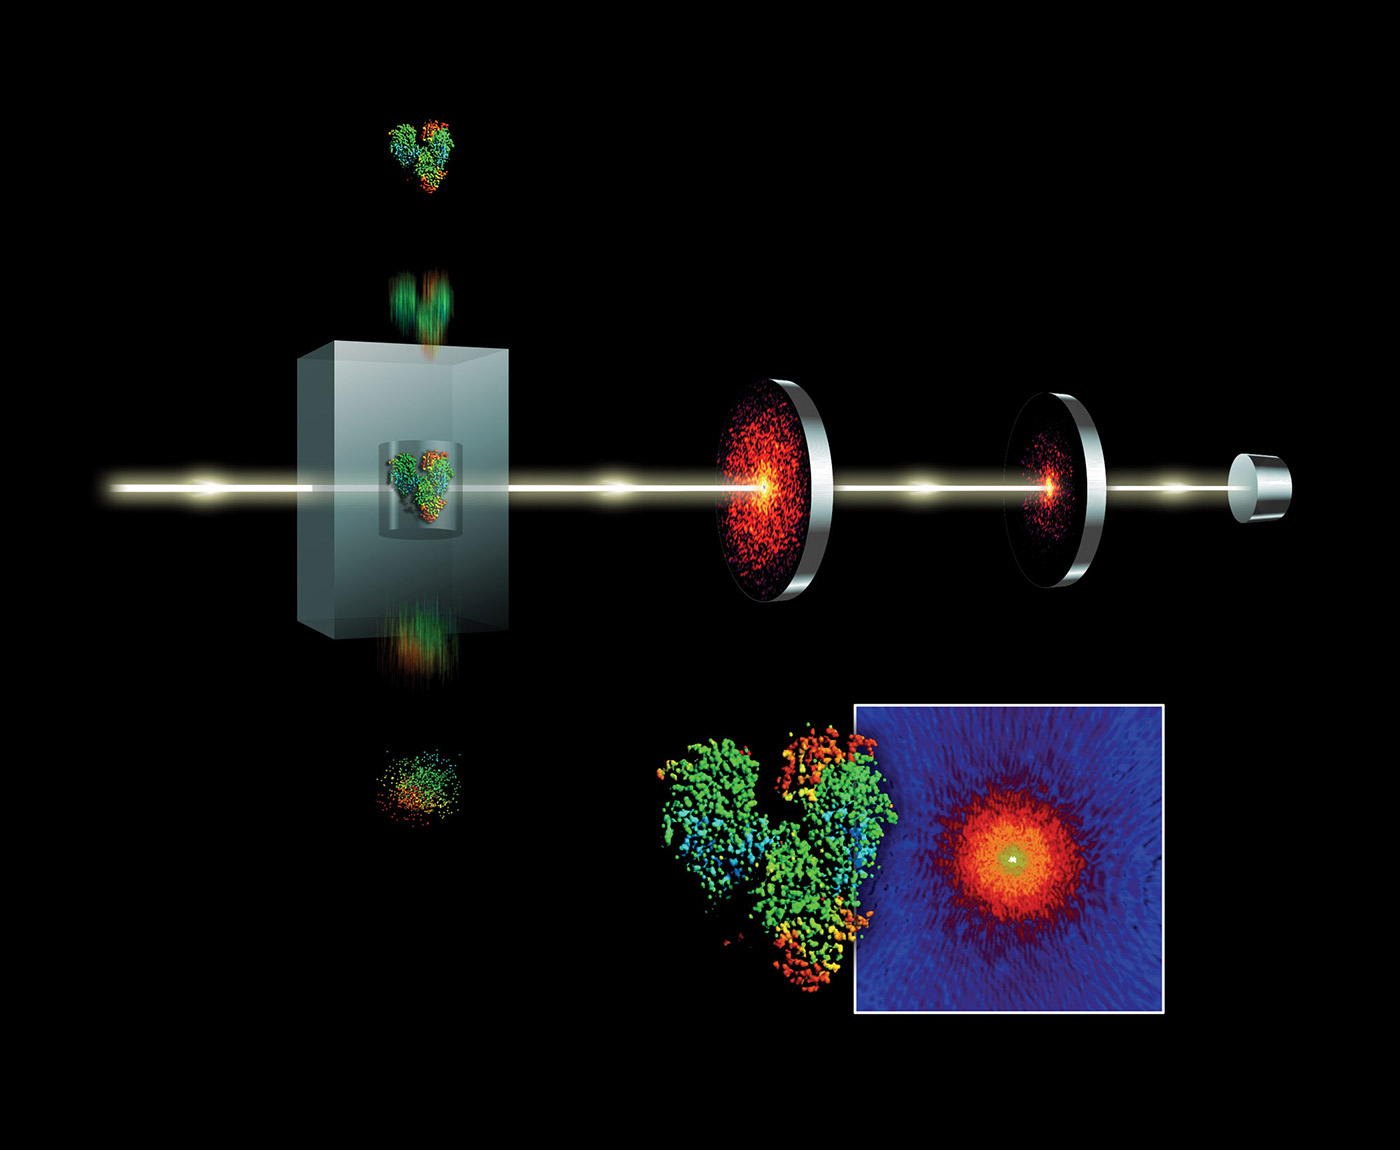
Free-electron lasers (FELs) have many applications. Diffract-and-destroy experiments such as those done at Linear Coherent Light Source (LCLS) to accurately determine three-dimensional structures of nano-scale systems can produce 150 TB of data per sample. Scientists seek out FEL beamlines in part to image biological systems in their native state. Determining the structure of complex bio-chemical engines involved in photosynthesis and metabolism is complicated by the fact that these systems do not easily form crystals. However, using FEL’s fast and bright bursts of light we can accurately resolve these structures despite this constraint. Liquid nanocrystalline samples are aerosolized as they are injected into the LCLS beamline and individually drift in the path of the x-ray beam. As a droplet is destroyed by an x-ray pulse, but before the nuclei can move, a diffraction pattern is registered on a detector. Images are combined and collected from a sequence of these pulses to reconstruct fundamental chemical and biological processes. Diffract-and-destroy methods, however, allow for imaging of tiny samples (nanocrystallography) without the need to grow large crystals. This data-intensive technique has been applied to imaging studies of photosynthesis and protein chemistry. The use of streaming data analytics and machine learning will become more important in meeting these data challenges. The data rates from future FEL science (see Figure 6) will require fast analytic filters such as classification on streams of data as they are collected.
Data acquisition and ingestion
The bursty nature of x-ray free electron laser (XFEL) data is in part due to the high pulse rate of the laser and also uncertainties in sample preparation. With a good sample, the data production rate may be close to peak (0.5 GB/s) but can vary significantly over a 12-hour beamtime shift. Diffractive images acquired on the CSPAD detector are sent through front-end electronics to a local file system that then buffers events (per pulse data) into 20-GB chunks in a custom binary XTC file format. (XTC to HDF conversion is supported.)
Data storage and transfer
Currently data sets are stored at LCLS temporarily while users ship their data through transfer nodes. Internal-to-LCLS data management is handled by integrated Rule-Oriented Data Systems (IRODS). Data transfer nodes at each site handle movement of data to NERSC’s Cori system for analysis. The process is not fully automated, but advances are being made through HPC-connected APIs, sponsorship of storage resources across facilities, and workflow containerization. Advances in software defined networking (SDN) and growing WAN bandwidth from ESnet are important in connecting the instrument to HPC.
Data processing and analysis
XFEL experiments vary widely, and beamlines do not have a single type of analysis. At LCLS, the largest data and computing demands come from nanocrystallography and single particle imaging. In these analyses, streams of images are fed through a series of analysis kernels to find high-quality diffraction data and are then used to reconstruct or improve a spatial model of the sample. This workflow has a large data movement phase in which images are streamed from the instrument detector to a parallel filesystem. This is followed by compute phases that are dominated by compute-intensive image analysis kernels (Fourier and Winograd transforms). In the case of diffuse x-ray scattering experiments, the image stream may be compared to concurrently running molecular dynamics simulations. Those operating the device benefit from fast feedback analysis, but researchers also conduct multiple offline analyses months after the experiment is completed. Fast feedback analysis can work with reduced or filtered data streams, and offline analyses are typically exhaustive over the entire data set.
The future
The future of FEL science focuses on faster pulse rates of brighter and more coherent photons. An upgrade to LCLS-II in 2019 will increase repetition rates from 120 Hz toward 50 KHz. In the same timeframe, detector resolution will increase four-fold, and sample preparation and delivery technologies will also see advances in throughput. Future FELs are planning for two to three orders of magnitude increase in data production and analysis needs. Future compute node architectures suited to image analysis kernels (e.g., hardware accelerators) will greatly accelerate the analysis of such a growing volume of data. An ongoing collaboration between the SLAC National Accelerator Laboratory, ESnet, and Lawrence Berkeley National Laboratory seeks to orchestrate the network, computing, and storage resources to meet this challenge.
Primary Collaborator: David Skinner (LBNL)