Analytics frameworks for the startup lifecycle
This chapter from Lean Analytics reviews the various frameworks that exist for growing your business and keeping up with the changes that come with that growth.
 Alexandra Exter - sketch. (source: Wikimedia Commons)
Over the years we’ve seen a number of frameworks emerge that help us understand startups and the changes they undergo as they grow, find their markets, and help startups acquire customers and revenue. Each framework offers a different perspective on the startup lifecycle, and each suggests a set of metrics and areas on which to focus.
After comparing and contrasting a number of these frameworks, we’ve created our own way to think about startups, and in particular the metrics that you use to measure your progress. We’ll use this new framework throughout the book—but first, let’s take a look at some of the existing frameworks and how they fit into Lean Analytics.

Learn faster. Dig deeper. See farther.
Dave McClure’s Pirate Metrics
Pirate Metrics—a term coined by venture capitalist Dave McClure—gets its name from the acronym for five distinct elements of building a successful business. McClure categorizes the metrics a startup needs to watch into acquisition, activation, retention, revenue, and referral—AARRR.1
Figure 1-1 shows our interpretation of his model, describing the five steps through which users, customers, or visitors must progress in order for your company to extract all the value from them. Value comes not only from a transaction (revenue) but also from their role as marketers (referral) and content creators (retention).
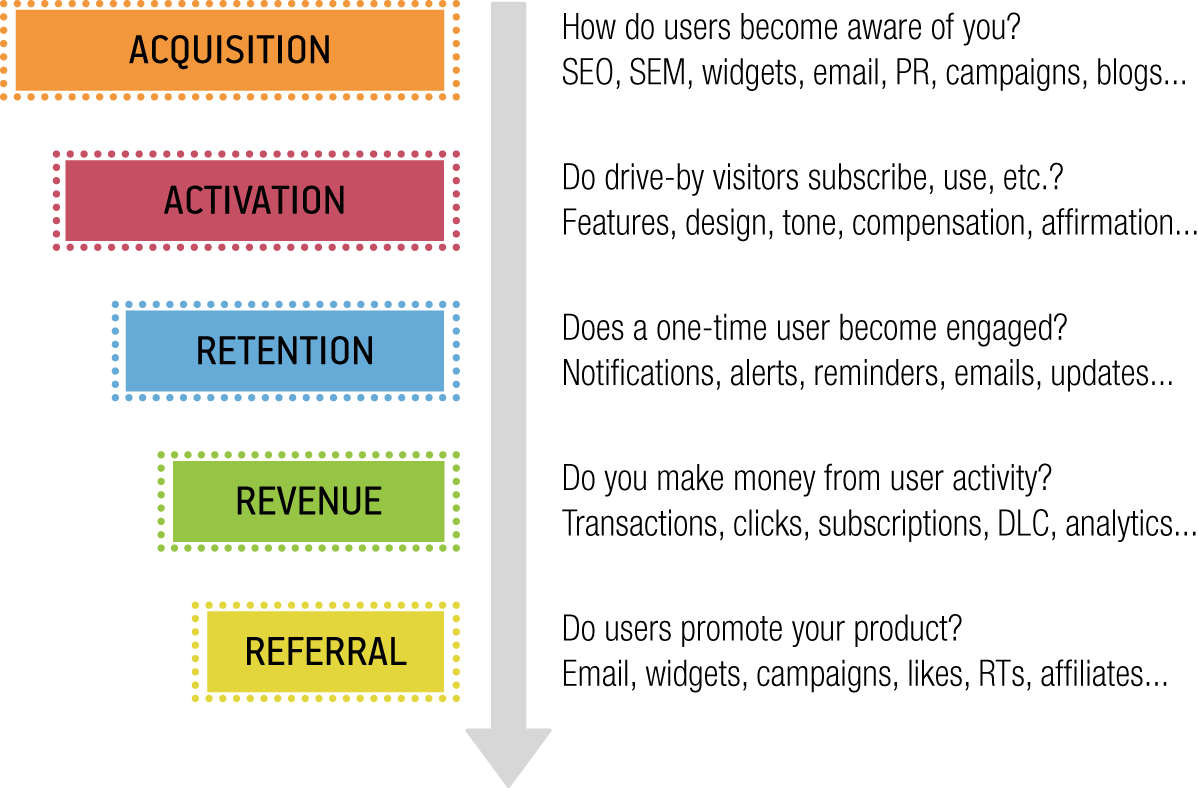
These five elements don’t necessarily follow a strict order—users may refer others before they spend money, for example, or may return several times before signing up—but the list is a good framework for thinking about how a business needs to grow (see Table 1-1).
| Element | Function | Relevant metrics |
|---|---|---|
| Acquisition | Generate attention through a variety of means, both organic and inorganic | Traffic, mentions, cost per click, search results, cost of acquisition, open rate |
| Activation | Turn the resulting drive-by visitors into users who are somehow enrolled | Enrollments, signups, completed onboarding process, used the service at least once, subscriptions |
| Retention | Convince users to come back repeatedly, exhibiting sticky behavior | Engagement, time since last visit, daily and monthly active use, churns |
| Revenue | Business outcomes (which vary by your business model: purchases, ad clicks, content creation, subscriptions, etc.) | Customer lifetime value, conversion rate, shopping cart size, click-through revenue |
| Referral | Viral and word-of-mouth invitations to other potential users | Invites sent, viral coefficient, viral cycle time |
Eric Ries’s Engines of Growth
In Lean Startup, Eric Ries talks about three engines that drive the growth of a startup. Each of these has associated key performance indicators (KPIs).
Sticky Engine
The sticky engine focuses on getting users to return, and to keep using your product. It’s akin to Dave McClure’s retention phase. If your users aren’t sticky, churn will be high, and you won’t have engagement. Engagement is one of the best predictors of success: Facebook’s early user counts weren’t huge, but the company could get nearly all students in a university to use the product, and to keep coming back, within a few months of launch. Facebook’s stickiness was off the charts.
The fundamental KPI for stickiness is customer retention. Churn rates and usage frequency are other important metrics to track. Long-term stickiness often comes from the value users create for themselves as they use the service. It’s hard for people to leave Gmail or Evernote, because, well, that’s where they store all their stuff. Similarly, if a player deletes his account from a massively multiplayer online game (MMO), he loses all his status and in-game items, which he’s worked hard to earn.
Stickiness isn’t only about retention, it’s also about frequency, which is why you also need to track metrics like time since last visit. If you have methods of driving return visits such as email notifications or updates, then email open rates and click-through rates matter, too.
Virality Engine
Virality is all about getting the word out. Virality is attractive because it compounds—if every user adds another 1.5 users, your user base will grow infinitely until you’ve saturated all users.2
The key metric for this engine is the viral coefficient—the number of new users that each user brings on. Because this is compounding (the users they bring, in turn, bring their own users), the metric measures how many users are brought in with each viral cycle. Growth comes from a viral coefficient of greater than one, but you also have to factor in churn and loss. The bigger the coefficient, the faster you grow.
Measuring viral coefficient isn’t enough. You also need to measure the actions that make up the cycle. For example, when you join most social networks, you’re asked to connect to your email account to find contacts, then you’re given the option to invite them. They receive emails, which they might act upon. Those distinct stages all contribute to virality, so measuring actions is how you tweak the viral engine—by changing the message, simplifying the signup process, and so on.
There are other factors at play with virality as well, including the speed with which a user invites another (known as the viral cycle time) and the type of virality. We’ll dive into these later in the book.
Paid Engine
The third engine of growth is payment. It’s usually premature to turn this engine on before you know that your product is sticky and viral. Meteor Entertainment’s Hawken is a multiplayer game that’s free to play, but it makes money from in-game upgrades. Meteor is focusing on usage within a beta group first (stickiness), then working on virality (inviting your friends to play), and finally payment (players buying upgrades to become competitive or enhance the in-game experience).
Getting paid is, in some ways, the ultimate metric for identifying a sustainable business model. If you make more money from customers than it costs you to acquire them—and you do so consistently—you’re sustainable. You don’t need money from external investors, and you’re growing shareholder equity every day.
But getting paid, on its own, isn’t an engine of growth. It’s just a way to put money in the bank. Revenue helps growth only when you funnel some of the money generated from revenue back into acquisition. Then you have a machine that you can tune to grow the business over time.
The two knobs on this machine are customer lifetime value (CLV) and customer acquisition cost (CAC). Making more money from customers than you spend acquiring them is good, but the equation for success isn’t that simple. You still need to worry about cash flow and growth rate, which are driven by how long it takes a customer to pay off. One way to measure this is time to customer breakeven—that is, how much time it will take to recoup the acquisition cost of a customer.
Ash Maurya’s Lean Canvas
We looked at the Lean Canvas in not available, when we talked about deciding what problem you should solve. See the sidebar undefined ‘1-1’ for some tips on putting it into practice.
Each of the boxes in Ash’s canvas has relevant metrics you need to track, as outlined in Table 1-2 (the canvas actually has a box for metrics, which should get updated each time you focus on something different in the canvas). These metrics either tie your one-page business model to reality by confirming each box, or they send you back to the drawing board. The individual metrics may change depending on your type of business, but the guidelines are valuable just the same. We’ll share more details later in the book on the key metrics that matter based on your type of business, as well as benchmarks you can aim for.
Sean Ellis’s Startup Growth Pyramid
Sean Ellis is a well-known entrepreneur and marketer. He coined the term growth hacker and has been heavily involved with a number of meteoric-growth startups, including Dropbox, Xobni, LogMeIn (IPO), and Uproar (IPO). His Startup Growth Pyramid, shown in Figure 1-2, focuses on what to do after you’ve achieved product/market fit.
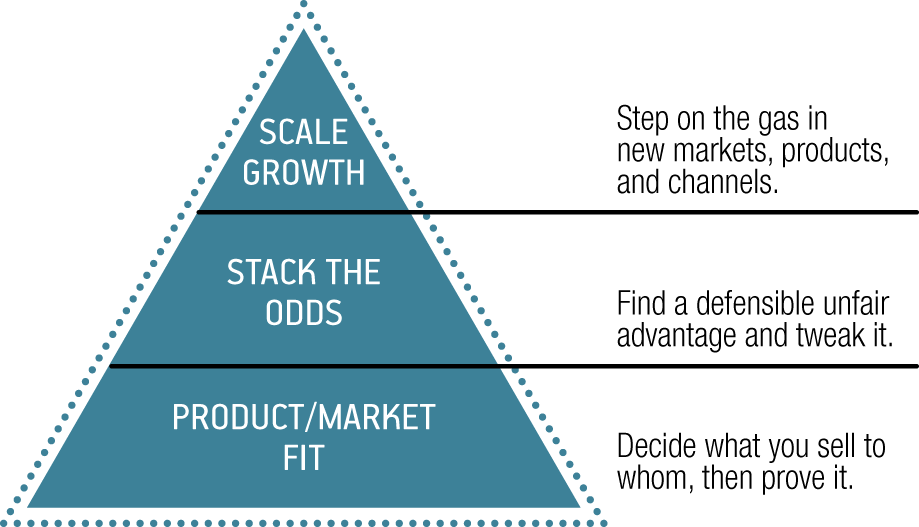
The question this poses a of course, is how do you know if you’ve achieved product/market fit? Sean devised a simple survey that you can send customers (available at survey.io) to determine if you’re ready for accelerated growth. The most important question in the survey is “How would you feel if you could no longer use this product or service?” In Sean’s experience, if 40% of people (or more) say they’d be very disappointed to lose the service, you’ve found a fit, and now it’s time to scale.
The Long Funnel
In the early days of the Web, transactional websites had relatively simple conversion funnels. Visitors came to the home page, navigated to the product they wanted, entered payment information, and confirmed their order.
No more. Today’s funnel extends well beyond the front door of a website, across myriad social networks, sharing platforms, affiliates, and price-comparison sites. Both offline and online factors influence a single purchase. Customers may make several tentative visits prior to a conversion.
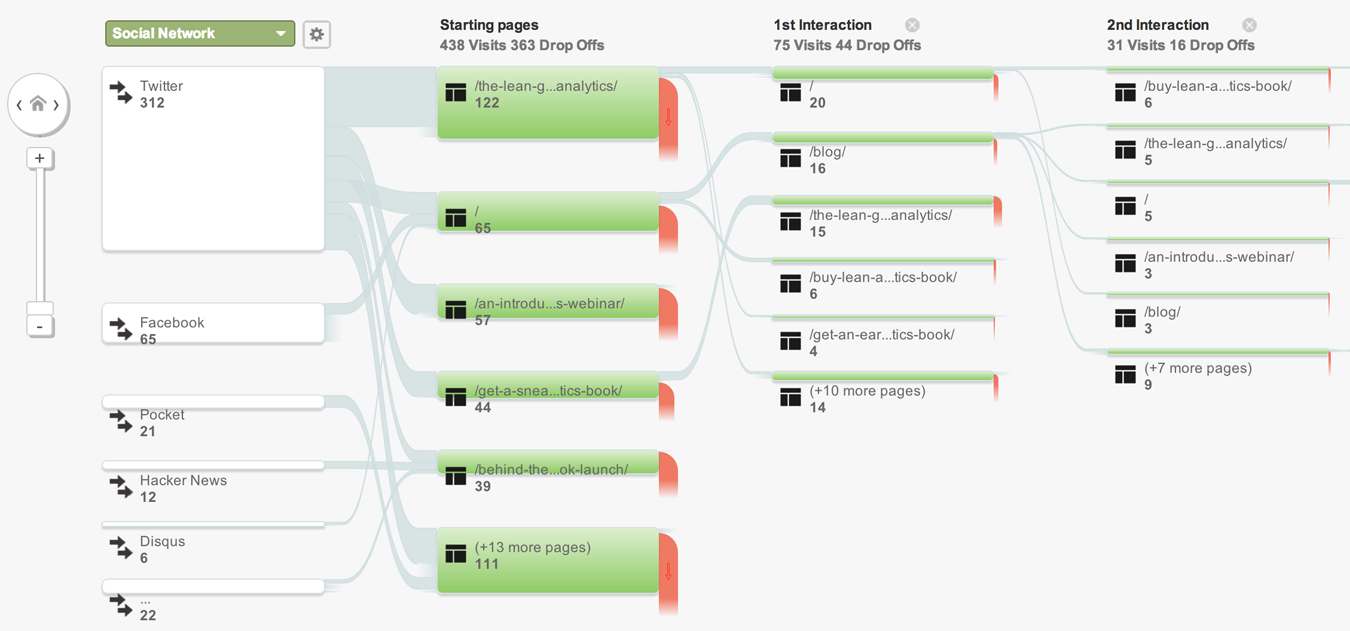
We call this the Long Funnel. It’s a way of understanding how you first come to someone’s attention, and the journey she takes from that initial awareness through to a goal you want her to complete (such as making a purchase, creating content, or sharing a message). Often, measuring a long funnel involves injecting some kind of tracking into the initial signal, so you can follow the user as she winds up on your site, which many analytics packages can now report. Figure 1-3 shows the Social Visitors Flow report in Google Analytics, for example.
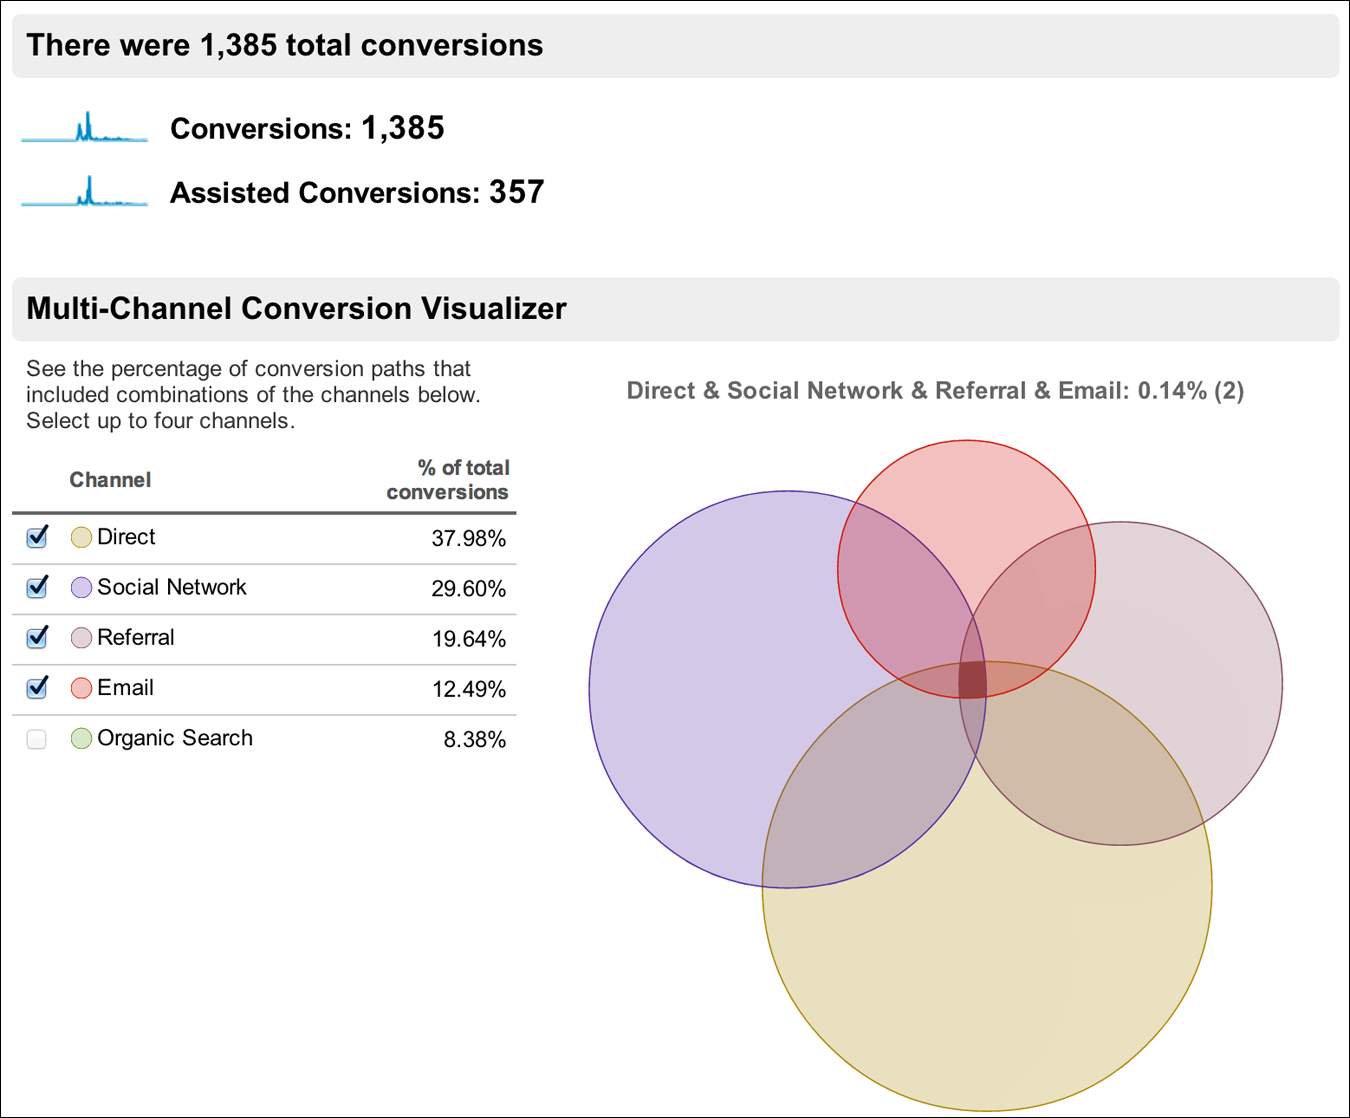
What’s more, overlapping traffic sources can show how much a particular platform influenced conversions, as shown in Figure 1-4.
We tracked our own long funnel during the process of launching the Lean Analytics Book website.3 We didn’t have a hard “goal” such as a purchase, but we did have a number of things we wanted visitors to do: sign up for our mailing list, click on the book cover, and take a survey. By creating custom URLs for our proponents to share, we injected a signal into the start of the Long Funnel, and were able to see how our message spread.
We learned, for example, that author and speaker Julien Smith’s followers were less likely to fill out the survey than Eric Ries’s and Avinash Kaushik’s followers, unless they were returning visitors, in which case they were more likely to do so. This kind of insight can help us choose the right kind of proponent for future promotional efforts.
The Lean Analytics Stages and Gates
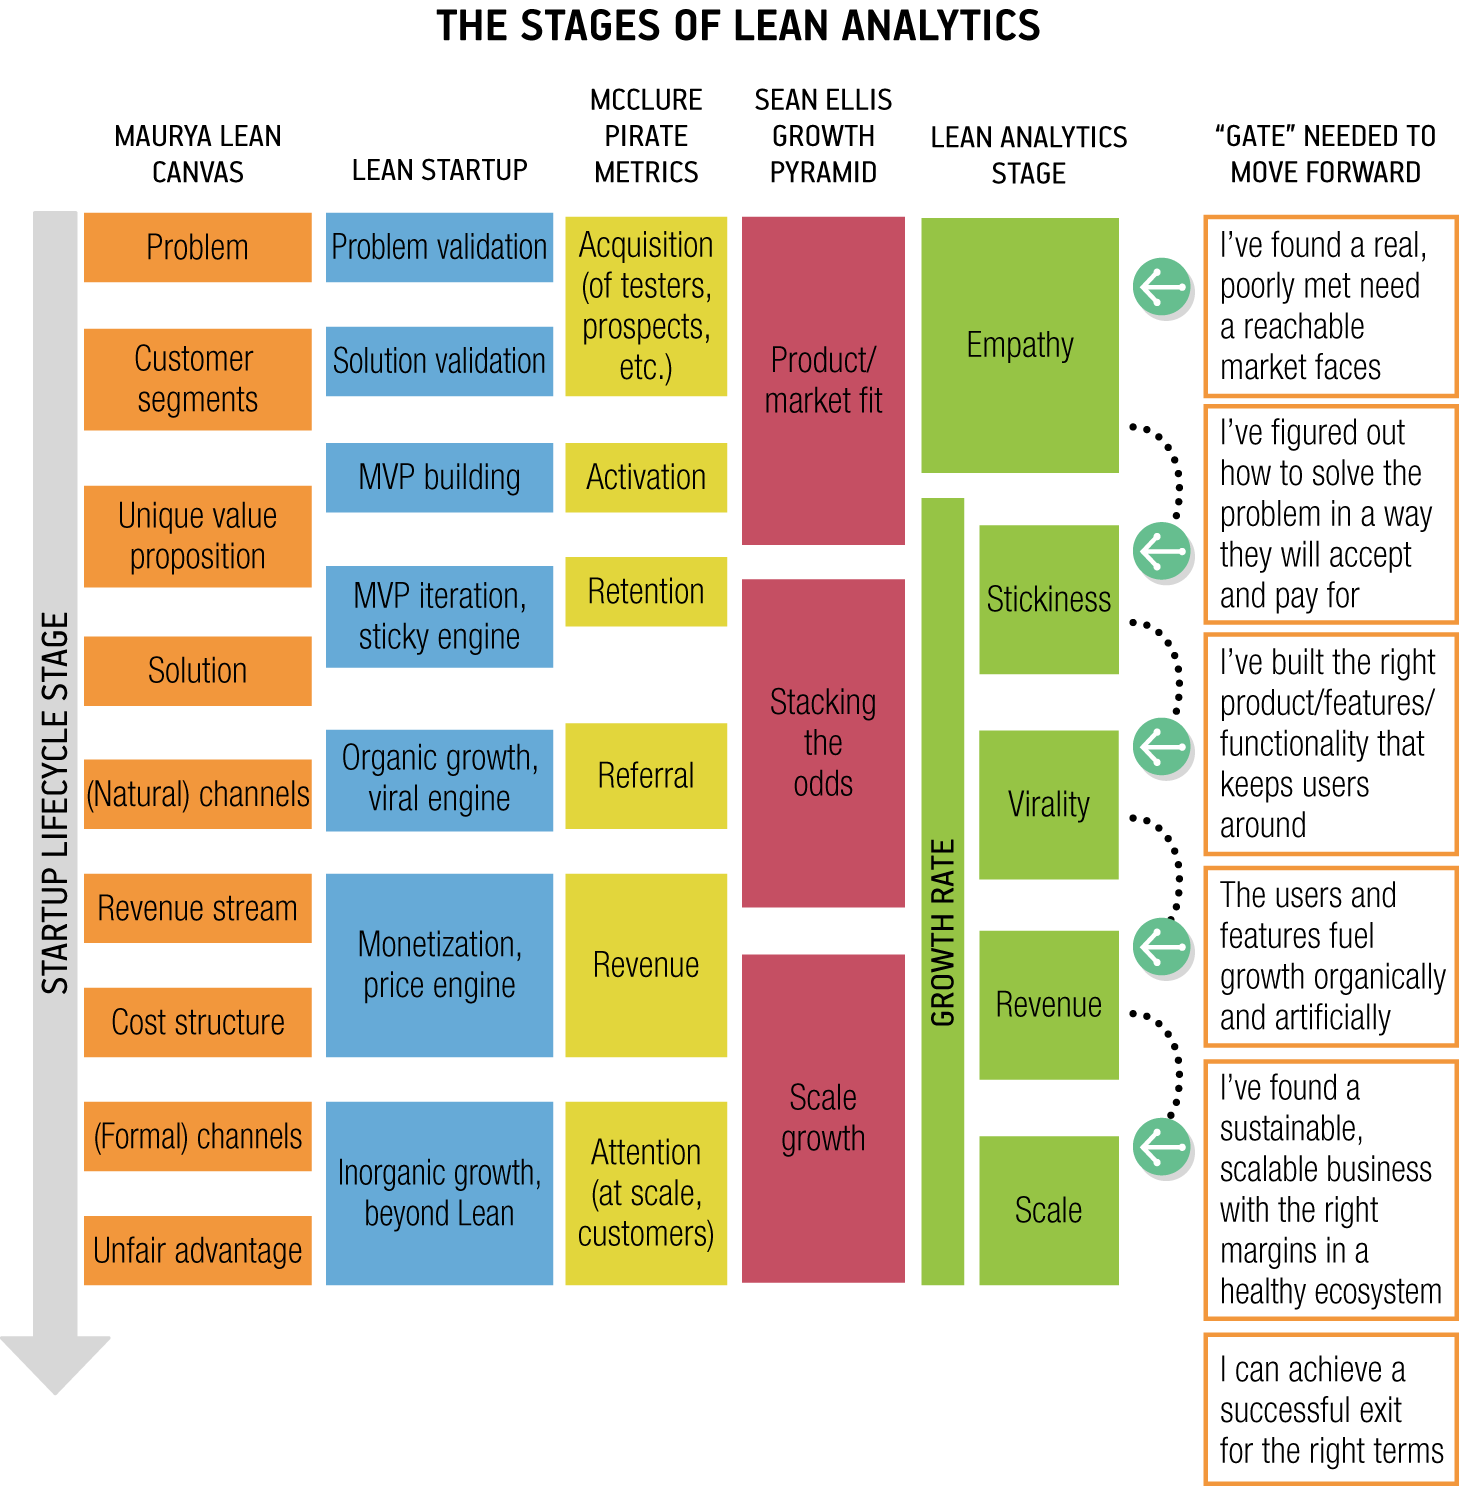
Having reviewed these frameworks, we needed a model that identified the distinct stages a startup usually goes through, and what the “gating” metrics should be that indicate it’s time to move to the next stage. The five stages we identified are Empathy, Stickiness, Virality, Revenue, and Scale. We believe most startups go through these stages, and in order to move from one to the next they need to achieve certain goals with respect to the metrics they’re tracking.
Figure 1-5 shows the stages and gates of Lean Analytics, and how this model lines up with the other frameworks. A good portion of the book is structured by our stages, so it’s important to understand how this works.
Ultimately, there are a number of good frameworks that help you think about your business.
- Some, like Pirate Metrics and the Long Funnel, focus on the act of acquiring and converting customers.
- Others, like the Engines of Growth and the Startup Growth Pyramid, offer strategies for knowing when or how to grow.
- Some, like the Lean Canvas, help you map out the components of your business model so you can evaluate them independent of one another.
We’re proposing a new model called the Lean Analytics Stages, which draws from the best of these models and puts an emphasis on metrics. It identifies five distinct stages startups go through as they grow.
While we believe the Lean Analytics Stages represent a fairly simple framework for understanding your startup’s progress, we recognize that it can still look overwhelming. And even with our framework, you’ll still use the other frameworks as well, so there’s a lot to digest. That’s why you should put all of this aside (for now!) and focus on the One Metric That Matters, which we’ll cover in the next chapter.
1http://www.slideshare.net/dmc500hats/startup-metrics-for-pirates-long-version
2It’s never really this simple; churn, competitors, and other factors mean it’s not really infinite, of course.
3http://leananalyticsbook.com/behind-the-scenes-of-a-book-launch/