

 Mindful instruction (source: Magnus D on Flickr)
 In this chapter, you will find recipes that deal with both app-level and cluster-level maintenance. We cover various aspects of troubleshooting, from debugging pods and containers, to testing service connectivity, interpreting a resource’s status, and node maintenance. Last but not least, we look at how to deal with etcd, the Kubernetes control plane storage component. This chapter is relevant for both cluster admins and app developers.
Enabling Autocomplete for kubectl
Problem
It is cumbersome to type full commands and arguments for the kubectl command, so you want an autocomplete function for it.
Solution
Enable autocompletion for kubectl.
For Linux and the bash shell, you can enable kubectl autocompletion in your current shell using the following command:
$ source <(kubectl completion bash)
For other operating systems and shells, please check the documentation.
See Also
Removing a Pod from a Service
Problem
You have a well-defined service (see not available) backed by several pods. But one of the pods is misbehaving, and you would like to take it out of the list of endpoints to examine it at a later time.
Solution
Relabel the pod using the --overwrite option—this will allow you to change the value of the run label on the pod. By overwriting this label, you can ensure that it will not be selected by the service selector (not available) and will be removed from the list of endpoints. At the same time, the replica set watching over your pods will see that a pod has disappeared and will start a new replica.
To see this in action, start with a straightforward deployment generated with kubectl run (see not available):
$ kubectl run nginx --image nginx --replicas 4
When you list the pods and show the label with key run, you’ll see four pods with the value nginx (run=nginx is the label that is automatically generated by the kubectl run command):
$ kubectl get pods -Lrun
NAME                     READY     STATUS            RESTARTS   AGE       RUN
nginx-d5dc44cf7-5g45r    1/1       Running           0          1h        nginx
nginx-d5dc44cf7-l429b    1/1       Running           0          1h        nginx
nginx-d5dc44cf7-pvrfh    1/1       Running           0          1h        nginx
nginx-d5dc44cf7-vm764    1/1       Running           0          1h        nginx
You can then expose this deployment with a service and check the endpoints, which correspond to the IP addresses of each pod:
$ kubectl expose deployments nginx --port 80

$ kubectl get endpoints
NAME         ENDPOINTS                                                 AGE
nginx        172.17.0.11:80,172.17.0.14:80,172.17.0.3:80 + 1 more...   1h
Moving the first pod out of the service traffic via relabeling is done with a single command:
$ kubectl label pods nginx-d5dc44cf7-5g45r run=notworking --overwrite
Tip
To find the IP address of a pod, you can list the pod’s manifest in JSON and run a JQuery query:
$ kubectl get pods nginx-d5dc44cf7-5g45r -o json | \
  jq -r .status.podIP172.17.0.3
You will see a brand new pod appear with the label run=nginx, and you will see that your nonworking pod still exists but no longer appears in the list of service endpoints:
$ kubectl get pods -Lrun
NAME                     READY     STATUS        RESTARTS   AGE       RUN
nginx-d5dc44cf7-5g45r    1/1       Running       0          21h       notworking
nginx-d5dc44cf7-hztlw    1/1       Running       0          21s       nginx
nginx-d5dc44cf7-l429b    1/1       Running       0          5m        nginx
nginx-d5dc44cf7-pvrfh    1/1       Running       0          5m        nginx
nginx-d5dc44cf7-vm764    1/1       Running       0          5m        nginx

$ kubectl describe endpoints nginx
Name:         nginx
Namespace:    default
Labels:       run=nginx
Annotations:  <none>
Subsets:
  Addresses:          172.17.0.11,172.17.0.14,172.17.0.19,172.17.0.7
...
Accessing a ClusterIP Service Outside the Cluster
Problem
You have an internal service that is causing you trouble and you want to test that it is working well locally without exposing the service externally.
Solution
Use a local proxy to the Kubernetes API server with kubectl proxy.
Let’s assume that you have created a deployment and a service as described in Removing a Pod from a Service. You should see an nginx service when you list the services:
$ kubectl get svc
NAME         TYPE        CLUSTER-IP     EXTERNAL-IP   PORT(S)   AGE
nginx        ClusterIP   10.109.24.56   <none>        80/TCP    22h
This service is not reachable outside the Kubernetes cluster. However, you can run a proxy in a separate terminal and then reach it on localhost.
Start by running the proxy in a separate terminal:
$ kubectl proxy
Starting to serve on 127.0.0.1:8001
Tip
You can specify the port that you want the proxy to run on with the --port option.
In your original terminal, you can then use your browser or curl to access the application exposed by your service. Note the specific path to the service; it contains a /proxy part. Without this, you get the JSON object representing the service:
$ curl http://localhost:8001/api/v1/proxy/namespaces/default/services/nginx/
<!DOCTYPE html>
<html>
<head>
<title>Welcome to nginx!</title>
...
Note
Note that you can now also access the entire Kubernetes API over localhost using curl.
Understanding and Parsing Resource Statuses
Problem
You want to react based on the status of a resource—say, a pod—in a script or in another automated environment like a CI/CD pipeline.
Solution
Use kubectl get $KIND/$NAME -o json and parse the JSON output using one of the two methods described here.
If you have the JSON query utility jq installed, you can use it to parse the resource status. Let’s assume you have a pod called jump and want to know what Quality of Service (QoS) class1 the pod is in:
$ kubectl get po/jump -o json | jq --raw-output .status.qosClass
BestEffort
Note that the --raw-output argument for jq will show the raw value and that .status.qosClass is the expression that matches the respective subfield.
Another status query could be around the events or state transitions:
$ kubectl get po/jump -o json | jq .status.conditions
[
  {
    "lastProbeTime": null,
    "lastTransitionTime": "2017-08-28T08:06:19Z",
    "status": "True",
    "type": "Initialized"
  },
  {
    "lastProbeTime": null,
    "lastTransitionTime": "2017-08-31T08:21:29Z",
    "status": "True",
    "type": "Ready"
  },
  {
    "lastProbeTime": null,
    "lastTransitionTime": "2017-08-28T08:06:19Z",
    "status": "True",
    "type": "PodScheduled"
  }
]
Of course, these queries are not limited to pods—you can apply this technique to any resource. For example, you can query the revisions of a deployment:
$ kubectl get deploy/prom -o json | jq .metadata.annotations
{
  "deployment.kubernetes.io/revision": "1"
}
Or you can list all the endpoints that make up a service:
$ kubectl get ep/prom-svc -o json | jq '.subsets'
[
  {
    "addresses": [
      {
        "ip": "172.17.0.4",
        "nodeName": "minikube",
        "targetRef": {
          "kind": "Pod",
          "name": "prom-2436944326-pr60g",
          "namespace": "default",
          "resourceVersion": "686093",
          "uid": "eee59623-7f2f-11e7-b58a-080027390640"
        }
      }
    ],
    "ports": [
      {
        "port": 9090,
        "protocol": "TCP"
      }
    ]
  }
]
Now that you’ve seen jq in action, let’s move on to a method that doesn’t require external tooling—that is, the built-in feature of using Go templates.
The Go programming language defines templates in a package called text/template that can be used for any kind of text or data transformation, and kubectl has built-in support for it. For example, to list all the container images used in the current namespace, do this:
$ kubectl get pods -o go-template \
          --template="{{range .items}}{{range .spec.containers}}{{.image}} \
          {{end}}{{end}}"
busybox prom/prometheus
See Also
jq playground to try out queries without installing
jq
Debugging Pods
Problem
You have a situation where a pod is either not starting up as expected or fails after some time.
Solution
To systematically discover and fix the cause of the problem, enter an OODA loop:
Observe. What do you see in the container logs? What events have occurred? How is the network connectivity?
Orient. Formulate a set of plausible hypotheses—stay as open-minded as possible and don’t jump to conclusions.
Decide. Pick one of the hypotheses.
Act. Test the hypothesis. If it’s confirmed, you’re done; otherwise, go back to step 1 and continue.
Let’s have a look at a concrete example where a pod fails. Create a manifest called unhappy-pod.yaml with this content:
apiVersion:       extensions/v1beta1
kind:             Deployment
metadata:
  name:           unhappy
spec:
  replicas:       1
  template:
    metadata:
      labels:
        app:      nevermind
    spec:
      containers:
      - name:     shell
        image:    busybox
        command:
        - "sh"
        - "-c"
        - "echo I will just print something here and then exit"
Now when you launch that deployment and look at the pod it creates, you’ll see it’s unhappy:
$ kubectl create -f unhappy-pod.yaml
deployment "unhappy" created

$ kubectl  get po
NAME                       READY     STATUS             RESTARTS   AGE
unhappy-3626010456-4j251   0/1       CrashLoopBackOff   1          7s

$ kubectl describe po/unhappy-3626010456-4j251
Name:           unhappy-3626010456-4j251
Namespace:      default
Node:           minikube/192.168.99.100
Start Time:     Sat, 12 Aug 2017 17:02:37 +0100
Labels:         app=nevermind
                pod-template-hash=3626010456
Annotations:    kubernetes.io/created-by={"kind":"SerializedReference","apiVersion":
"v1","reference":{"kind":"ReplicaSet","namespace":"default","name":
"unhappy-3626010456","uid":
"a9368a97-7f77-11e7-b58a-080027390640"...
Status:         Running
IP:             172.17.0.13
Created By:     ReplicaSet/unhappy-3626010456
Controlled By:  ReplicaSet/unhappy-3626010456
...
Conditions:
  Type          Status
  Initialized   True
  Ready         False
  PodScheduled  True
Volumes:
  default-token-rlm2s:
    Type:       Secret (a volume populated by a Secret)
    SecretName: default-token-rlm2s
    Optional:   false
QoS Class:      BestEffort
Node-Selectors: <none>
Tolerations:    <none>
Events:
  FirstSeen   ...   Reason                  Message
  ---------   ...   ------                  -------
  25s         ...   Scheduled               Successfully assigned
                                            unhappy-3626010456-4j251 to minikube
  25s         ...   SuccessfulMountVolume   MountVolume.SetUp succeeded for
                                            volume "default-token-rlm2s"
  24s         ...   Pulling                 pulling image "busybox"
  22s         ...   Pulled                  Successfully pulled image "busybox"
  22s         ...   Created                 Created container
  22s         ...   Started                 Started container
  19s         ...   BackOff                 Back-off restarting failed container
  19s         ...   FailedSync              Error syncing pod
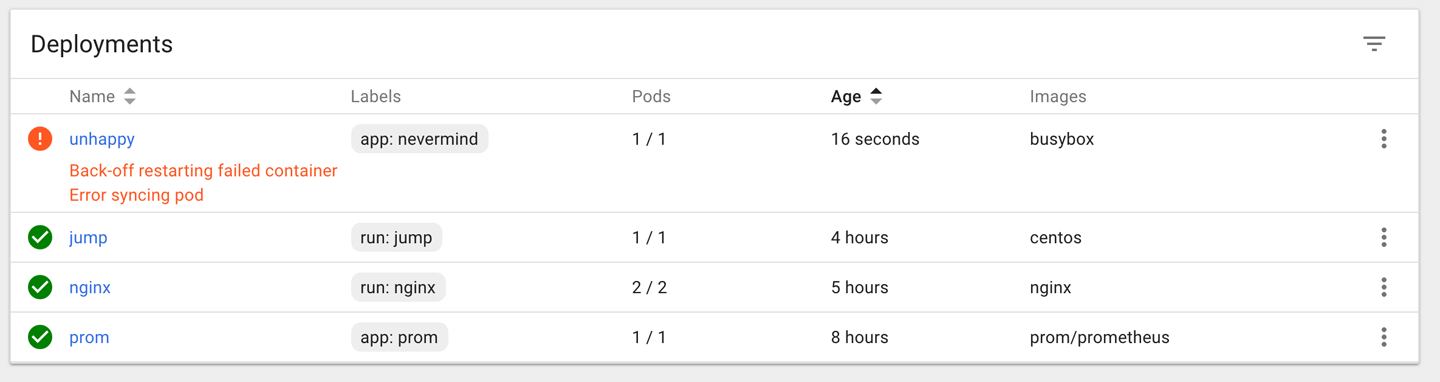
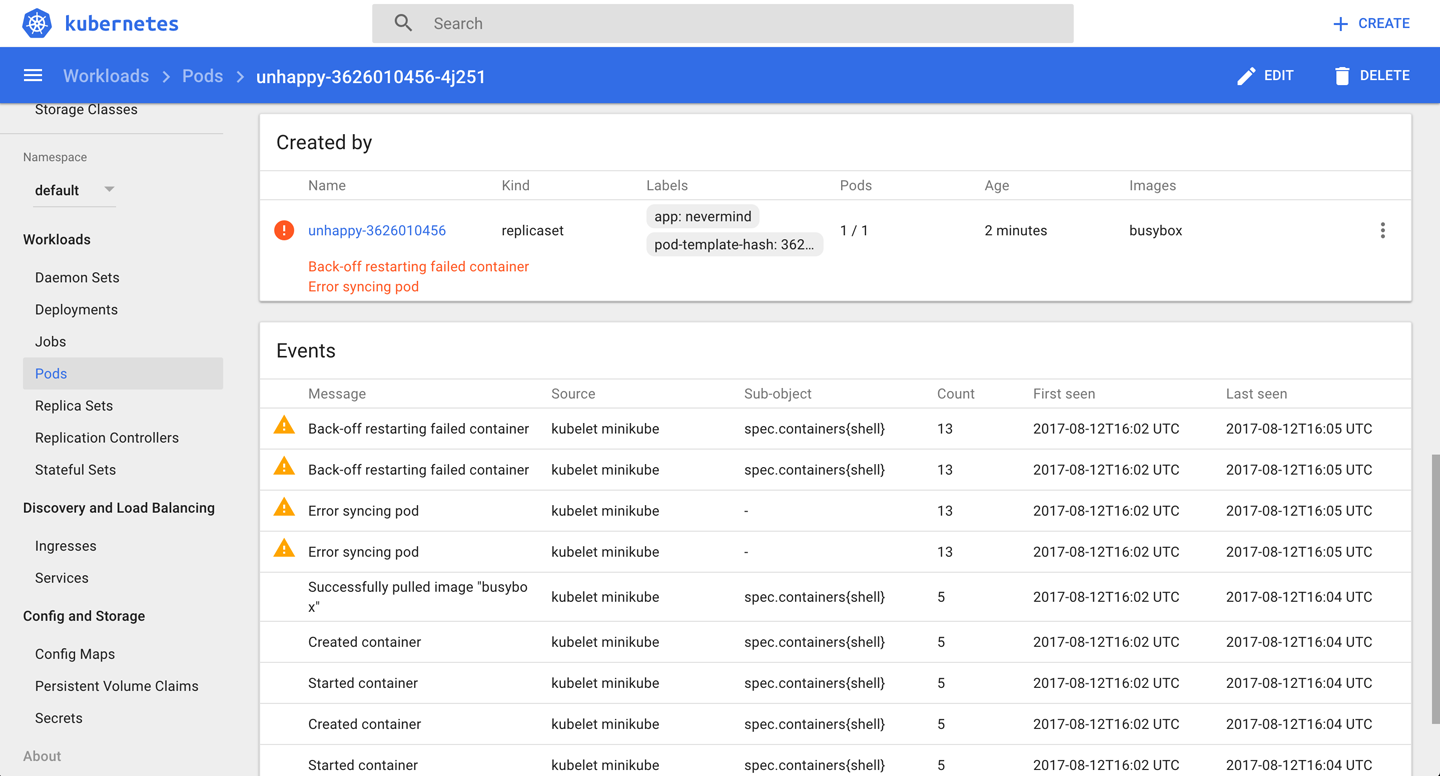
As you can see, Kubernetes considers this pod as not ready to serve traffic as it encountered an “error syncing pod.”
Another way to observe this is using the Kubernetes dashboard to view the deployment (Figure 1), as well as the supervised replica set and the pod (Figure 2).
Discussion
An issue, be it a pod failing or a node behaving strangely, can have many different causes. Here are some things you’ll want to check before suspecting software bugs:
Is the manifest correct? Check with the Kubernetes JSON schema.
Does the container run standalone, locally (that is, outside of Kubernetes)?
Can Kubernetes reach the container registry and actually pull the container image?
Can the nodes talk to each other?
Can the nodes reach the master?
Is DNS available in the cluster?
Are there sufficient resources available on the nodes?
Did you restrict the container’s resource usage?
See Also
Getting a Detailed Snapshot of the Cluster State
Problem
You want to get a detailed snapshot of the overall cluster state for orientation, auditing, or troubleshooting purposes.
Solution
Use the kubectl cluster-info dump command. For example, to create a dump of the cluster state in a subdirectory cluster-state-2017-08-13, do this:
$ kubectl cluster-info dump --all-namespaces \
  --output-directory=$PWD/cluster-state-2017-08-13

$ tree ./cluster-state-2017-08-13
.
├── default
│   ├── cockroachdb-0
│   │   └── logs.txt
│   ├── cockroachdb-1
│   │   └── logs.txt
│   ├── cockroachdb-2
│   │   └── logs.txt
│   ├── daemonsets.json
│   ├── deployments.json
│   ├── events.json
│   ├── jump-1247516000-sz87w
│   │   └── logs.txt
│   ├── nginx-4217019353-462mb
│   │   └── logs.txt
│   ├── nginx-4217019353-z3g8d
│   │   └── logs.txt
│   ├── pods.json
│   ├── prom-2436944326-pr60g
│   │   └── logs.txt
│   ├── replicasets.json
│   ├── replication-controllers.json
│   └── services.json
├── kube-public
│   ├── daemonsets.json
│   ├── deployments.json
│   ├── events.json
│   ├── pods.json
│   ├── replicasets.json
│   ├── replication-controllers.json
│   └── services.json
├── kube-system
│   ├── daemonsets.json
│   ├── default-http-backend-wdfwc
│   │   └── logs.txt
│   ├── deployments.json
│   ├── events.json
│   ├── kube-addon-manager-minikube
│   │   └── logs.txt
│   ├── kube-dns-910330662-dvr9f
│   │   └── logs.txt
│   ├── kubernetes-dashboard-5pqmk
│   │   └── logs.txt
│   ├── nginx-ingress-controller-d2f2z
│   │   └── logs.txt
│   ├── pods.json
│   ├── replicasets.json
│   ├── replication-controllers.json
│   └── services.json
└── nodes.json
Adding Kubernetes Worker Nodes
Problem
Solution
Provision a new machine in whatever way your environment requires (for example, in a bare-metal environment you might need to physically install a new server in a rack, in a public cloud setting you need to create a new VM, etc.), and then install the three components that make up a Kubernetes worker node:
kubeletThis is the node manager and supervisor for all pods, no matter if they’re controlled by the API server or running locally, such as static pods. Note that the
kubeletis the final arbiter of what pods can or cannot run on a given node, and takes care of:Reporting node and pod statuses to the API server.
Periodically executing liveness probes.
Mounting the pod volumes and downloading secrets.
Controlling the container runtime (see the following).
Container runtimeThis is responsible for downloading container images and running the containers. Initially, this was hardwired to the Docker engine, but nowadays it is a pluggable system based on the Container Runtime Interface (CRI), so you can, for example, use CRI-O rather than Docker.
kube-proxyThis process dynamically configures iptables rules on the node to enable the Kubernetes service abstraction (redirecting the VIP to the endpoints, one or more pods representing the service).
The actual installation of the components depends heavily on your environment and the installation method used (cloud, kubeadm, etc.). For a list of available options, see the kubelet reference and kube-proxy reference.
Discussion
Worker nodes, unlike other Kubernetes resources such as a deployments or services, are not directly created by the Kubernetes control plane but only managed by it. That means when Kubernetes creates a node, it actually only creates an object that represents the worker node. It validates the node by health checks based on the node’s metadata.name field, and if the node is valid—that is, all necessary components are running—it is considered part of the cluster; otherwise, it will be ignored for any cluster activity until it becomes valid.
See Also
“The Kubernetes Node” in the Kubernetes Architecture design document
Draining Kubernetes Nodes for Maintenance
Problem
You need to carry out maintenance on a node—for example, to apply a security patch or upgrade the operating system.
Solution
Use the kubectl drain command. For example, to do maintenance on node 123-worker:
$ kubectl drain 123-worker
When you are ready to put the node back into service, use kubectl uncordon 123-worker, which will make the node schedulable again.
Discussion
What the kubectl drain command does is to first mark the specified node un-schedulable to prevent new pods from arriving (essentially a kubectl cordon). Then it evicts the pods if the API server supports eviction. Otherwise, it will use normal kubectl delete to delete the pods. The Kubernetes docs have a concise sequence diagram of the steps, reproduced in Figure 3.
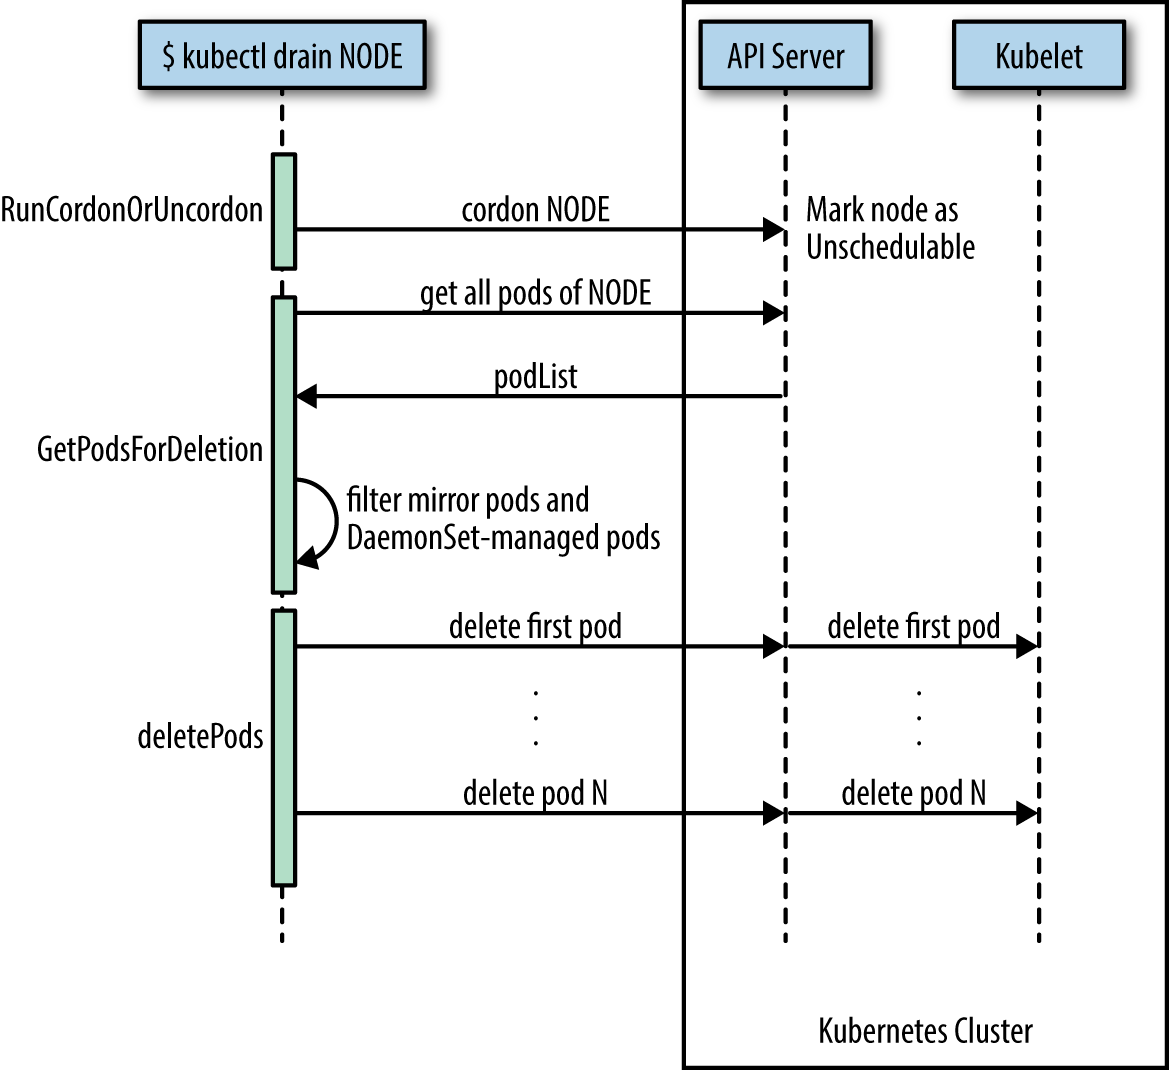
The kubectl drain command evicts or deletes all pods except mirror pods (which cannot be deleted through the API server). For pods supervised by a DaemonSet, drain will not proceed without using --ignore-daemonsets, and regardless it will not delete any DaemonSet-managed pods—those pods would be immediately replaced by the DaemonSet controller, which ignores unschedulable markings.
Warning
drain waits for graceful termination, so you should not operate on this node until the kubectl drain command has completed. Note that kubectl drain $NODE --force will also evict pods not managed by an RC, RS, job, DaemonSet, or StatefulSet.
See Also
Managing etcd
Problem
You need to access etcd to back it up or verify the cluster state directly.
Solution
Get access to etcd and query it, either using curl or etcdctl. For example, in the context of Minikube (with jq installed):
$ minikube ssh

$ curl 127.0.0.1:2379/v2/keys/registry | jq .
{
  "action": "get",
  "node": {
    "key": "/registry",
    "dir": true,
    "nodes": [
      {
        "key": "/registry/persistentvolumeclaims",
        "dir": true,
        "modifiedIndex": 241330,
        "createdIndex": 241330
      },
      {
        "key": "/registry/apiextensions.k8s.io",
        "dir": true,
        "modifiedIndex": 641,
        "createdIndex": 641
      },
...
This technique can be used in environments where etcd is used with the v2 API.
Discussion
In Kubernetes, etcd is a component of the control plane. The API server (see not available) is stateless and the only Kubernetes component that directly communicates with etcd, the distributed storage component that manages the cluster state. Essentially, etcd is a key/value store; in etcd2 the keys formed a hierarchy, but with the introduction of etcd3 this was replaced with a flat model (while maintaining backwards compatibility concerning hierarchical keys).
Note
Up until Kubernetes 1.5.2 we used etcd2, and from then on we switched to etcd3. In Kubernetes 1.5.x, etcd3 is still used in v2 API mode and going forward this is changing to the etcd v3 API with v2 being deprecated soon. Though from a developer’s point of view this doesn’t have any implications, because the API server takes care of abstracting the interactions away, as an admin you want to pay attention to which etcd version is used in which API mode.
In general, it’s the responsibility of the cluster admin to manage etcd—that is, to upgrade it and make sure the data is backed up. In certain environments where the control plane is managed for you, such as in Google Kubernetes Engine, you cannot access etcd directly. This is by design, and there’s no workaround for it.
See Also
“Accessing Localkube Resources from Inside a Pod: Example etcd” in the Minikube docs
Stefan Schimanski and Michael Hausenblas’s blog post “Kubernetes Deep Dive: API Server – Part 2”
Michael Hausenblas’s blog post “Notes on Moving from etcd2 to etcd3”