
 Fractal spiral (source: Pixabay)
 As an individual, I’ve been doing Agile data science—the iterative and evolutionary development of analytics applications—for a decade, since before I knew what to call it. Working as a lone full-stack developer, it was only natural to iteratively evolve the analytics software I built. When I joined a team, I expected things to work that way. They didn’t.
I had been exposed to Agile methods as a web developer, so I was surprised when I entered my first job as a data scientist to find that data science wasn’t Agile. Within weeks of arriving at that job, I had to specify a complex predictive system that I then handed off to someone else who needed six months to build it before it was deployed. This violated everything I knew about how to build software, but the scale of the system and the state of big data tools made this necessary. The project nearly failed and was rescued at the last minute. I lost a lot of sleep, and learned some important lessons.
I never wanted to go through that again. So, I tried to impose Agile on data science, with varying degrees of success. As I began to apply methods from Agile software development to data science, I saw a pattern emerge. The difficulty was not in the implementation specifics, but in the way of thinking about Agile opportunities when working with data in addition to software.
As my experiences across multiple companies started to crystallize my thoughts, I developed the Agile Data Science Manifesto. The manifesto focuses on how to think, rather than on what to do. The specifics of Kanban or Scrum work for data science, so long as the team thinks dynamically in response to opportunities that emerge from exploring data. John Akred has done interesting work on the implementation specifics of Agile data science, but I remain unopinionated in terms of how you track work. The key is that you approach data science in an active and dynamic way.
The Agile data science manifesto
Iterate, iterate, iterate
Insight comes from the 25th query in a chain of queries, not the first one. Data tables have to be parsed, formatted, sorted, aggregated, and summarized before they can be understood. Insightful charts typically come from the third or fourth attempt, not the first. Building accurate predictive models can take many iterations of feature engineering and hyperparameter tuning. In data science, iteration is the essential element to the extraction, visualization, and productization of insight. When we build, we iterate.

Ship intermediate output
Iteration is the essential act in crafting analytics applications, which means we’re often left at the end of a sprint with things that aren’t complete. If we didn’t ship incomplete or intermediate output by the end of a sprint, we would often end up shipping nothing at all. And that isn’t Agile; I call it the “death loop,” where endless time can be wasted perfecting things nobody wants.
Good systems are self-documenting, and in Agile data science, we document and share the incomplete assets we create as we work. We commit all work to source control. We share this work with teammates and, as soon as possible, with end users. This principle isn’t obvious to everyone. Many data scientists come from academic backgrounds, where years of intense research effort went into a single large paper called a thesis that resulted in an advanced degree.

Perform experiments, not tasks
In software engineering, a product manager assigns a chart to a developer to implement during a sprint. The developer translates the assignment into a SQL GROUP BY and creates a web page for it. Mission accomplished? Wrong. Charts that are specified this way are unlikely to have value. Data science differs from software engineering in that it is part science, part engineering.
In any given task, we must iterate to achieve insight, and these iterations can best be summarized as experiments. Managing a data science team means overseeing multiple concurrent experiments more than it means handing out tasks. Good assets (tables, charts, reports, predictions) emerge as artifacts of exploratory data analysis, so we must think more in terms of experiments than tasks.
Listen to the data
What is possible is as important as what is intended. What is easy and what is hard are as important to know as what is desired. In software application development, there are three perspectives to consider: those of the customers, the developers, and the business. In analytics application development, there is another perspective: that of the data. Without understanding what the data “has to say” about any feature, the product owner can’t do a good job. The data’s opinion must always be included in product discussions, which means that they must be grounded in visualization through exploratory data analysis in the internal application that becomes the focus of our efforts.
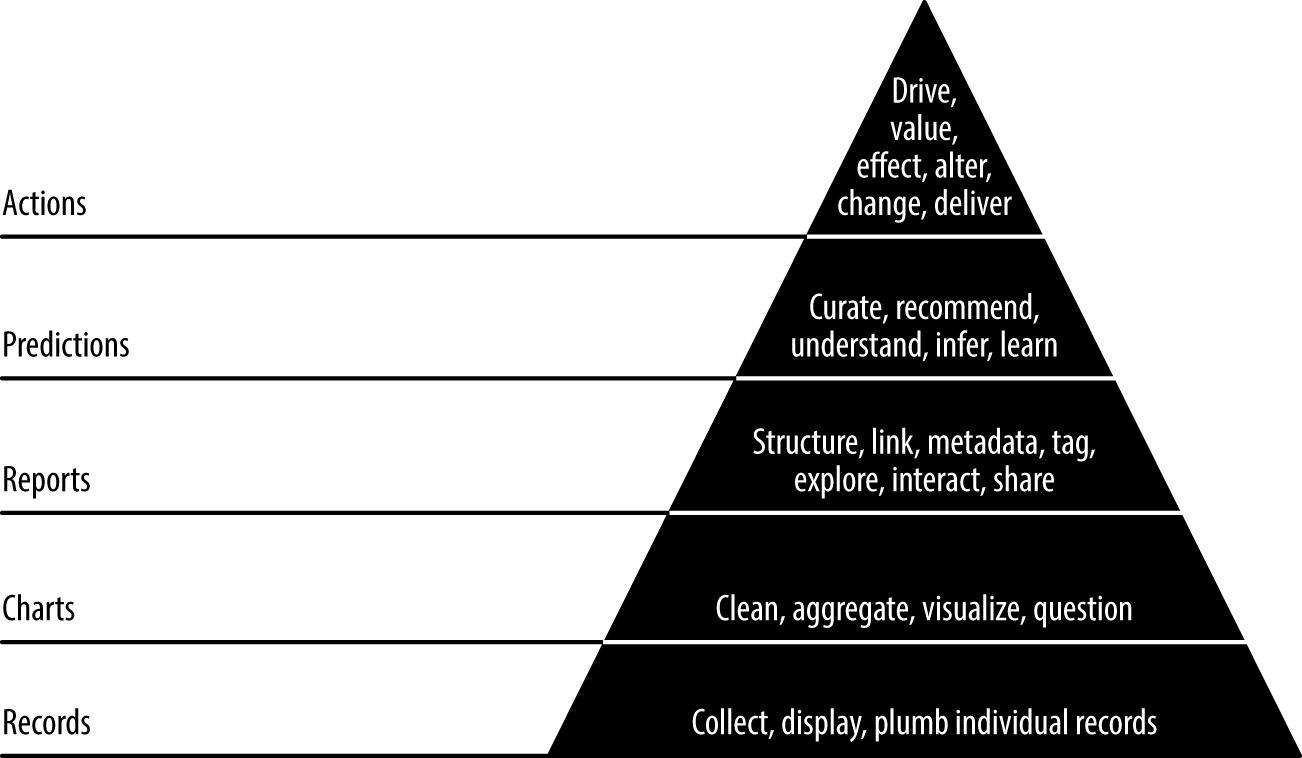
Respect the data-value pyramid
The data-value pyramid (Figure 1-2) is a five-level pyramid modeled after Maslow’s hierarchy of needs. It expresses the increasing amount of value created when refining raw data into tables and charts, followed by reports, then predictions, all of which is intended to enable new actions or improve existing ones:
- The first level of the data-value pyramid (records) is about plumbing; making a data set flow from where it is gathered to where it appears in an application.
- The charts and tables layer is the level where refinement and analysis begins.
- The reports layer enables immersive exploration of data, where we can really reason about it and get to know it.
- The predictions layer is where more value is created, but creating good predictions means feature engineering, which the lower levels encompass and facilitate.
- The final level, actions, is where the artificial intelligence (AI) craze is taking place. If your insight doesn’t enable a new action or improve an existing one, it isn’t very valuable.
The data-value pyramid gives structure to our work. The pyramid is something to keep in mind, not a rule to be followed. Sometimes you skip steps, sometimes you work backward. If you pull a new data set directly into a predictive model as a feature, you incur technical debt if you don’t make this data set transparent and accessible by adding it to your application data model in the lower levels. You should keep this in mind, and pay off the debt as you are able.
Find the critical path
To maximize our odds of success, we should focus most of our time on that aspect of our application that is most essential to its success. But which aspect is that? This must be discovered through experimentation. Analytics product development is the search for and pursuit of a moving goal.
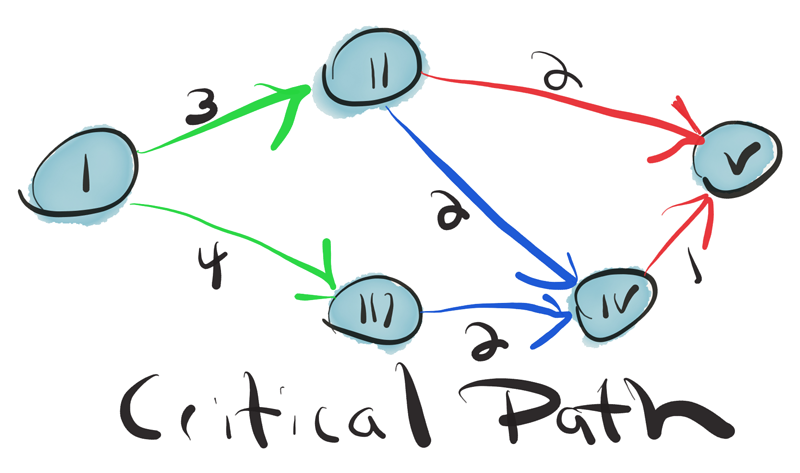
Once a goal is determined, for instance a prediction to be made, then we must find the critical path to its implementation and, if it proves valuable, to its improvement. Data is refined step by step as it flows from task to task. Analytics products often require multiple stages of refinement, the employment of extensive extract, transform, load (ETL) processes, techniques from statistics, information access, machine learning, artificial intelligence, and graph analytics.
The interaction of these stages can form complex webs of dependencies. The team leader holds this web in his head. It is his job to ensure the team discovers the critical path and then to organize the team around completing it. A product manager cannot manage this process from the top down; rather, a product scientist must discover it from the bottom up.
Get meta
If we can’t easily ship good product assets on a schedule comparable to developing a normal application, what will we ship? If we don’t ship, we aren’t Agile. To solve this problem, in Agile data science, we “get meta.” The focus is on documenting the analytics process as opposed to the end state or product we are seeking. This lets us be Agile and ship intermediate content as we iteratively climb the data-value pyramid to pursue the critical path to a killer product. So, where does the product come from? From the palette, we create by documenting our exploratory data analysis.

Synthesis
These seven principles work together to drive the Agile data science methodology. They serve to structure and document the process of exploratory data analysis and transform it into analytics applications.