September 2016
Beginner
40 pages
46m
English
DATA PROFESSIONALS ARE NOT A homogenous group— there are various types of roles in the space. While it is easier—and more common—to classify roles based on titles, clustering based on tools and tasks is a more rigorous way to define the key divisions between respondents of the survey. Every respondent is assigned to one of four clusters based on their tools and tasks.1
The four clusters were not evenly populated: their shares of the survey sample were 29%, 31%, 23%, and 17%, respectively. They can be described as shown on the right.
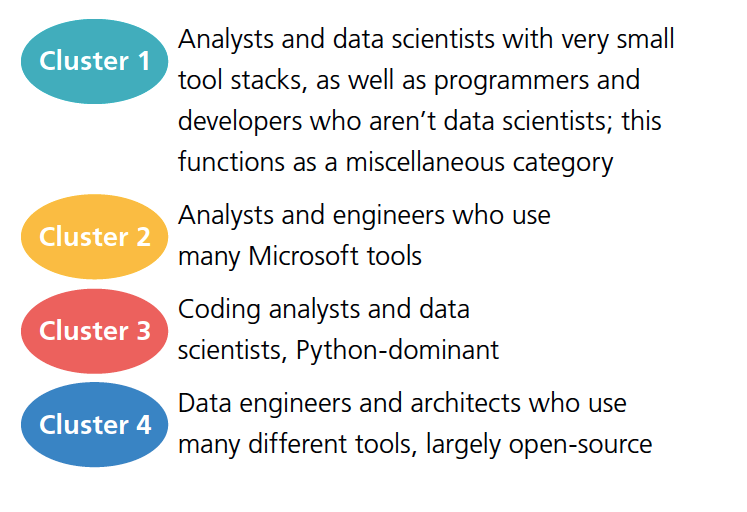
A selection of tool and task percentages are described in the sections that follow, and the full profiles of tool/task percentages are found in Appendix A.
In our three previous Data Science Salary Survey reports, the clearest division in tool clusters separated one group of open source, usually GUI-less tools, from another consisting of proprietary software, largely developed by Microsoft. Common tools in the open source group have been Linux, Python, Spark, Hadoop, and Java, and common tools in the Microsoft/ closed source group include Windows, Excel, Visual Basic, and MS SQL Server. This same division appears when we cluster respondents, and is clearest when we look at the usage of operating systems:
A set of tasks also emphasize the division between the ...