Modeling the Market
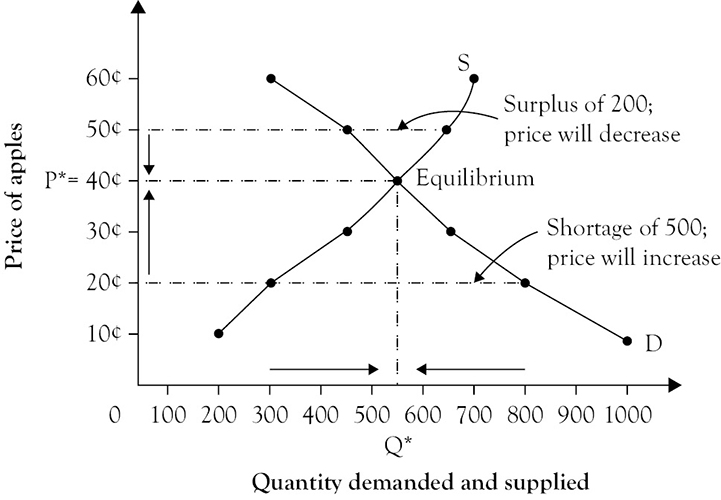
We can now examine how participants interact in a market. Table 2-3 and Figure 2-7 combine the previous demand and supply schedules.
Table 2-3. Adjustment to Equilibrium
|
Price |
Quantity demanded |
Quantity supplied |
Result |
Price Pressure |
|
60¢ |
300 |
700 |
Surplus |
Downward |
|
50¢ |
450 |
650 |
Surplus |
Downward |
|
40¢ |
550 |
550 |
Equilibrium |
None |
|
30¢ |
650 |
450 |
Shortage |
Upward |
|
20¢ |
800 |
300 |
Shortage |
Upward |
|
10¢ |
1000 |
200 |
Shortage |
Upward |

Figure 2-7. Adjustment to equilibrium.
When the price is 60¢ per apple, quantity supplied exceeds quantity demanded and ...
Get A Primer on Macroeconomics now with the O’Reilly learning platform.
O’Reilly members experience books, live events, courses curated by job role, and more from O’Reilly and nearly 200 top publishers.

