Using a crosstab query, you need to age transactions, grouped by Account ID, into ranges of 1-30 days, 31-60 days, 61-90 days, and greater than 120 days. You know that you can group transactions by month using the standard query tools, but you can’t find a way to group them by 30-day increments.
Access provides the seldom-used Partition function, which is perfect for this task. It allows you to take a range of values and partition it into even-sized chunks. By specifying a 30-day partition size, you can create a crosstab query that will give you the information you need.
To create a query in your own application, follow these steps:
Create a new query based on a table or query containing the appropriate account, date, and amount information.
Convert this query to a crosstab query by choosing the Query → Crosstab menu item or by clicking on the Crosstab button on the Query Design toolbar.
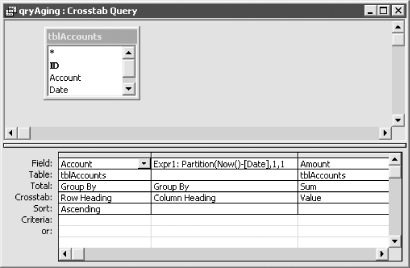
As when you create any crosstab query, specify at least three columns in the query grid: one for the column headings, one for the row headings, and one for the values that make up the crosstab. In this case, choose the account number (or account name, depending on your data) as the Row Heading and the amount (summed) as the Value. Figure 1-22 shows the sample query in design mode.
For the column headings, group the dates in 30-day increments, using the built-in Partition function. For this specific example, use the following value:
Expr1:Partition(Now( )-[Date],1,120,30)
for the column’s expression. This tells the query to break the information into groups based on the difference between today and the field named Date, starting with 1 day old, ending with 120 days old, and breaking every 30 days. Set the Total item to Group By and the Crosstab item to Column Heading.
When you execute the query, you will see output similar to that shown in Figure 1-24, which shows the aging data grouped in 30-day increments. You would usually create a report based on this query, but you can also use this raw output to get an overview of the aging of your receivables.
To see an example of a query that shows the aging of receivables,
load the sample database, 01-08.MDB. This
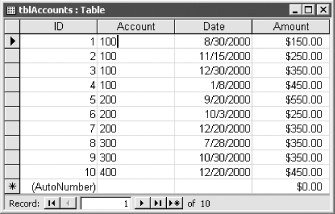
database includes a simple table, tblAccounts (see Figure 1-23), containing sample data about accounts and
their activity to be used in an aging query. The query qryAging,
shown in Figure 1-24, shows the final outcome: a
crosstab query including the aging information, grouped in 30-day
increments. You may want to update this small table with dates that
are closer to the date on which you are testing it.
Except for the use of the Partition function, this crosstab query is no different from any other. It summarizes rows of data, summing the amount column, grouped on a range of values in various columns. The only innovation is the use of the Partition function.
The
Partition function returns a string indicating
where a value occurs within a calculated series of ranges. That
string (in the format
start
:
end)
becomes the column heading in your query and is based on the starting
value, the ending value, and the range size. You tell Access each of
these values when you call the Partition
function. Table 1-5 shows the four parameters
you’ll use.
Table 1-5. Parameters for the Partition function
|
Argument |
Description |
|---|---|
|
|
Long integer to evaluate against specified ranges. |
|
|
A long integer: the start of the specified ranges. Can’t be less than 0. |
|
|
A long integer: the end of the specified ranges. Can’t be less
than the value specified in |
|
|
A long integer: the interval spanned by each range in the series from
|
For example, the following expression:
Partition( 42, 1, 120, 30)
would return the value "
31:
60". This function call asks, “Where does
the number 42 occur within the range of 1 to 120, broken into 30-day
ranges?” Clearly, it falls in the 31- to 60-day range.
That’s what’s indicated by the return value
"
31:
60"
from the previous example. In doing its calculation, Access formats
the result for you, in the format you see in the column headings in
Figure 1-25.
If a value falls outside the requested range, Access returns an
open-ended result. For example, the previous case will return
"121:
" if the value is greater
than 120 or "
:
0" if the value is less than 1. Access always
includes enough space in the two halves of the result string for the
largest possible value. This way, the result strings will sort
correctly.
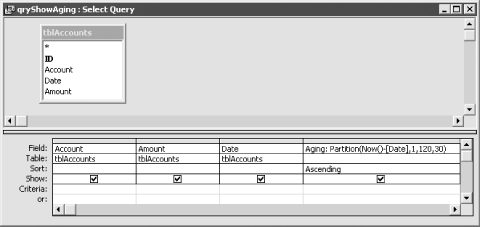
To see the Partition function doing its work,
open the query qryShowAging from 01-08.MDB in
design mode (see Figure 1-25). This simple select
query will show the account number, the amount due, the date on which
the transaction occurred, and the age range into which the
transaction fits, using the Partition function
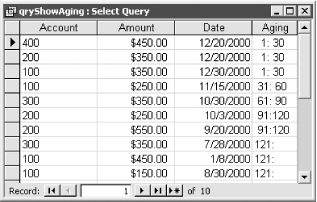
to calculate the ranges. Figure 1-26 shows the same
query in datasheet view, using the data as shown in Figure 1-23. The last column of the datasheet shows the
output from the Partition function. When you
group the rows on the values in this column, you end up with the
crosstab query you created earlier in this section.
There are some limitations to the Partition function. If you want uneven partitions, you’ll need to write your own VBA function to do the work. For example, if you want your partitions to be 0-30 days, 31-60 days, 61-90 days, and 91-120 days, you’d be out of luck with the Partition function: all the partitions specified are 30 days except the first, which is 31. In addition, using Partition in a crosstab query will omit ranges for which no values exist. For example, if no account has transactions between 31 and 60 days ago, there will be no column for this range in the output query. To avoid this problem, use fixed column headings (see Section 1.4.2 ).
Get Access Cookbook now with the O’Reilly learning platform.
O’Reilly members experience books, live events, courses curated by job role, and more from O’Reilly and nearly 200 top publishers.


