Create an Execution Time Profiler
Problem
You’d like to optimize your VBA code, but it’s almost impossible to tell how long Access is spending inside any one routine and it’s difficult to track which procedures are called by your code most often. You’d like some way to track which routines are called, in what order, and how much time each takes to run. Can you do this?
Solution
As outlined in Section 7.2.2 , you can create a code profiler using a stack data structure to keep track of the execution order and timing of the procedures in your application. Though the code involved is a bit more advanced than that in Section 7.2.2 , it’s not terribly difficult to create the profiler. Using it is simple, as all the work is wrapped up in a single module.
Steps
Open the database 07-03.MDB and load the module
basTestProfiler in design mode. In the debug window, type:
? A( )
to run the test procedures. Figure 7-4 shows the profile stack and the code in A. As you can see, A calls B, which calls C, which calls D, which waits 100 ms and then returns to C. C waits 100 ms and then calls D again. Once D returns, C returns to B, which waits 100 ms and then calls C again. This pattern repeats until the code gets back to A, where it finally quits. The timings in the profile stack in Figure 7-4 are actual timings from one run of the sample.
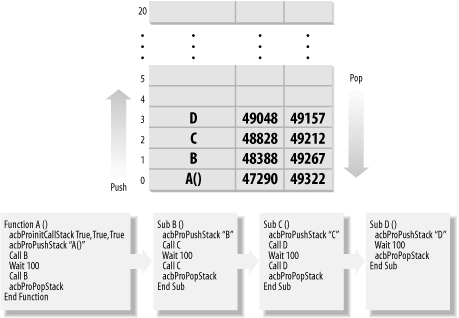
Figure 7-4. The profile stack and the sample routines used to ...
Get Access Cookbook now with the O’Reilly learning platform.
O’Reilly members experience books, live events, courses curated by job role, and more from O’Reilly and nearly 200 top publishers.

