Chapter 7. Exploring Data with Reports
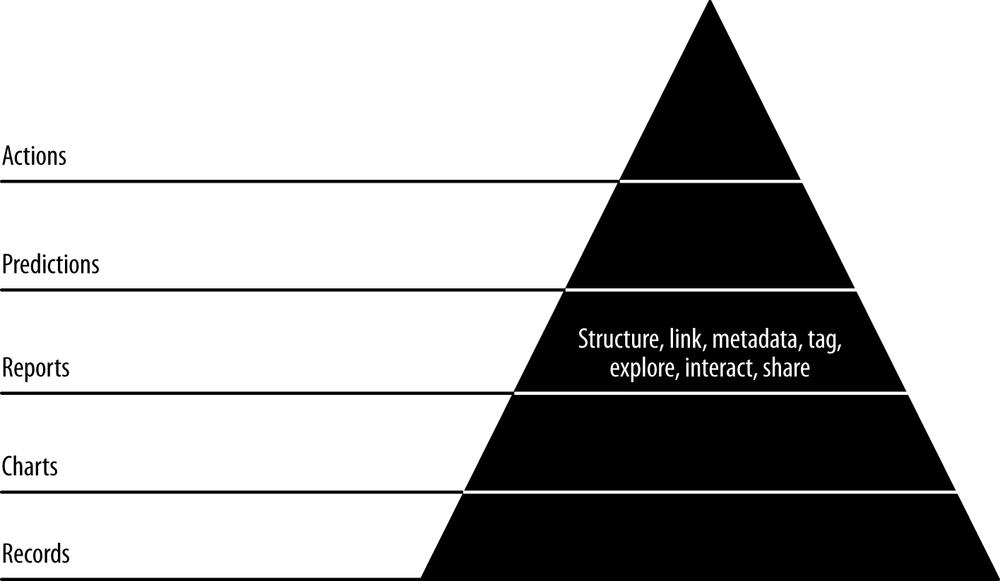
In the next step, our third agile sprint, we’ll extend our chart pages into full-blown reports (Figure 7-1). In this step, charts become interactive, static pages become dynamic, and our data becomes explorable through networks of linked, related entities with charts. These are the characteristics of the reports stage of the data-value pyramid.
Code examples for this chapter are available at https://github.com/rjurney/Agile_Data_Code/tree/master/ch07. Clone the repository and follow along!
git clone https://github.com/rjurney/Agile_Data_Code.git
Building Reports with Multiple Charts
To build a report, we need to compose multiple views on the same entity. The charts we made in the previous chapter will serve us well as we increase interactivity to create reports. Let’s create an email address entity page and add a tag cloud for related emails to give us something closer to a report.
We’ll start by creating a relation that shows the most related email addresses. Check out ch07/pig/related_email_addresses.pig.
/* Set Home Directory - where we install software */ %default HOME `echo \$HOME/Software/` /* Avro uses json-simple, and is in piggybank until Pig 0.12, where AvroStorage and TrevniStorage are Pig builtins */ REGISTER $HOME/pig/build/ivy/lib/Pig/avro-1.5.3.jar REGISTER $HOME/pig/build/ivy/lib/Pig/json-simple-1.1.jar ...
Get Agile Data Science now with the O’Reilly learning platform.
O’Reilly members experience books, live events, courses curated by job role, and more from O’Reilly and nearly 200 top publishers.

