17.4 FIELD MULTIPLICATION DEPENDENCE GRAPH
The iterations in Eq. 17.8 are defined over a two-dimensional (2-D) computation domain ![]() with the two indices i and j with the boundaries defined in Eq. 17.8. Since the dimensionality of
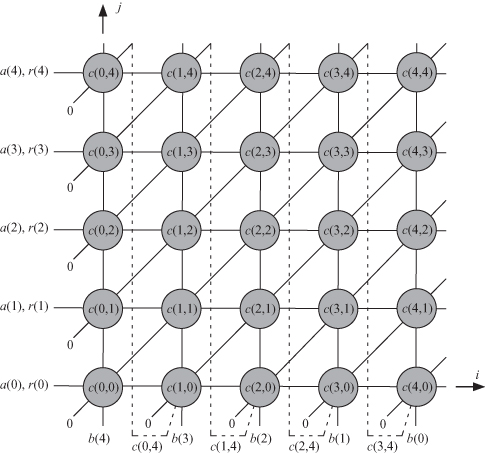
with the two indices i and j with the boundaries defined in Eq. 17.8. Since the dimensionality of ![]() is low, it is preferable to draw a dependence graph for the data and use the graphic and combinational geometric analysis tools discussed in Chapters 10 and 11. Figure 17.1 shows the dependence graph for the left-to-right shift-and-add field multiplication algorithm for m = 5. The algorithm has three input variables a, b and r and one output variable c.
is low, it is preferable to draw a dependence graph for the data and use the graphic and combinational geometric analysis tools discussed in Chapters 10 and 11. Figure 17.1 shows the dependence graph for the left-to-right shift-and-add field multiplication algorithm for m = 5. The algorithm has three input variables a, b and r and one output variable c.
Figure 17.1 Dependence graph for the left-to-right shift-and-add field multiplication algorithm for m = 5.

Input variables a(j) and r(j) will both map to horizontal lines. For example, input sample a(3) is associated with the line whose equation is i = 3. Also, a(j) or r(j) are fed to the system at one of two points (0, j) or (m − 1, j). We choose to feed the variable at the former point.
Input variable b(m − i) maps to vertical lines such that input instance b(3) maps to the line equation i = m − 3. Since in our case m = 5, instance b(3) maps to the line whose equation is i = 2 as shown in the figure. Also, ...
Get Algorithms and Parallel Computing now with the O’Reilly learning platform.
O’Reilly members experience books, live events, courses curated by job role, and more from O’Reilly and nearly 200 top publishers.

