3.2 Structure of a Model
Let rt be the log return of an asset at time index t. The basic idea behind volatility study is that the series {rt} is either serially uncorrelated or with minor lower order serial correlations, but it is a dependent series. For illustration, consider the monthly log stock returns of Intel Corporation from January 1973 to December 2008 shown in Figure 3.1. Figure 3.2(a) shows the sample ACF of the log return series, which suggests no significant serial correlations except for a minor one at lag 7. Figure 3.2(c) shows the sample ACF of the absolute log returns (i.e., |rt|), whereas Figure 3.2(b) shows the sample ACF of the squared log returns ![]() . These two plots clearly suggest that the monthly log returns are not serially independent. Combining the three plots, it seems that the log returns are indeed serially uncorrelated but dependent. Volatility models attempt to capture such dependence in the return series.
. These two plots clearly suggest that the monthly log returns are not serially independent. Combining the three plots, it seems that the log returns are indeed serially uncorrelated but dependent. Volatility models attempt to capture such dependence in the return series.
Figure 3.1 Time plot of monthly log returns of Intel stock from January 1973 to December 2008.
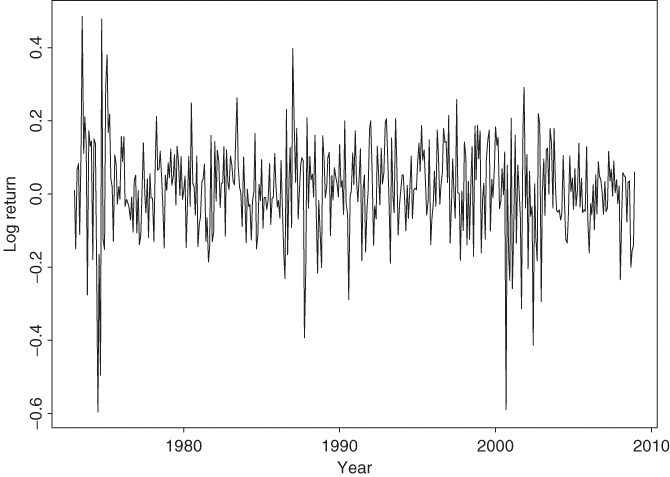
Figure 3.2 Sample ACF and PACF of various functions of monthly log stock returns of Intel Corporation from January 1973 to December 2008: (a) ACF of the log returns, (b) ACF of the squared log returns, (c) ACF of the absolute log returns, and (d) PACF of ...
Get Analysis of Financial Time Series, Third Edition now with the O’Reilly learning platform.
O’Reilly members experience books, live events, courses curated by job role, and more from O’Reilly and nearly 200 top publishers.

