Regardless of whether you are fortunate enough to have had your app written up on a blog, received stellar ratings and reviews on the App Store, or achieved some of your initial goals, you’ll need to be diligent and proactive with ongoing development of your app. Whether you have tasted success or are still seeking it, you’ll need to keep interacting with customers and determine how your app should evolve over time...or if it should.
In this chapter, you’ll explore:
Monitoring feedback and analyzing your app’s performance
Keeping customers interested and involved in your app
Preparing and submitting updates to the App Store
Assessing the future of your app
Some congratulations are due if you’ve made it this far. Launching an app into the App Store the way you did is no small feat. You know, of course, that your job is not done yet. Depending on how everything proceeds, you may in fact just be starting your job...literally. Going forward, it’s possible that your app may allow you to dedicate much more time to it than before you shipped it. You could, for example, become focused exclusively on apps at work, have apps represent an extra or even a sole source of income (through sales or building apps for others), or just see them as a serious (yet fun) hobby.
That type of change will be influenced, in part, by how your app fares in the App Store. Everything you’ve done up to this point has put you in a position to be more successful than your competition. To continue to be at an advantage, you’ll need to recognize that you aren’t at the finish line yet and that there may indeed be no finish line. Before thinking too long-term, however, you’ll want to begin monitoring feedback and looking at the performance of your app once it’s available in the App Store.
More broadly, you can think about two types of feedback for your app: qualitative and quantitative. Qualitative feedback is what people will be saying about your app on websites, blogs, Twitter, App Store reviews, and other channels. This feedback may come directly to you, such as through email, or it may require you to be on the lookout for it, as with a blog review of your app.
Quantitative feedback is numerical in nature, consisting of analytics (you did install analytics as recommended in Chapter 7, right?) and data that Apple provides. By using qualitative and quantitative feedback in conjunction, you’ll have a very complete picture of how your app is performing.
Note
Qualitative and quantitative feedback will provide actionable insight and often requires you to do more significant activities in response to it (e.g., fix or update your app). In this section, you’ll be focused exclusively on where to monitor and collect feedback. Taking more substantial action in response to this information will be covered in the next section. In the meantime, be sure you are answering support requests through Twitter, email, and other channels, as well as engaging customers and media where appropriate (e.g., commenting on a blog post that reviews your app).
Qualitative feedback is generally text-based and will sometimes require you to infer conclusions. Here are some examples of where you can go to find qualitative feedback:
Twitter acts as a gateway for what’s happening on the Web. This means you’ll be able to monitor what customers say about your app directly through mentions (when they send an update with “@<yourusername>”), and indirectly when, for example, a blogger may review your app and subsequently share that link on Twitter. The second situation is possible through monitoring keywords related to your app, which I wrote about in Chapter 8.
Once your app is launched, you may want to expand the keywords you are tracking based on how you see customers or the media discussing your app. Although your app probably has a core set of keywords that are most relevant, consider tracking keywords for specific features. Continue to experiment with what keywords to track based on the results that emerge. As you get more comfortable, include search operators to create more advanced and useful queries to track (http://search.twitter.com/operators).
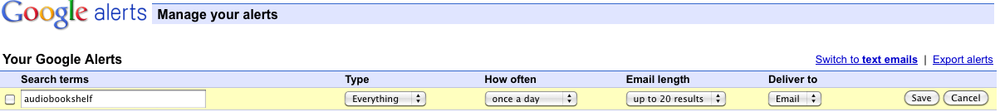
- Google Alerts
Twitter will not catch every review or mention about your app on the Web. To help gain more comprehensive coverage, you will turn to Google Alerts (http://www.google.com/alerts).
Google Alerts (see Figure 9-1) is a powerful tool that, like Twitter, allows you to monitor keywords. The two differences are that Google will look across the entire Web (five categories, including news and video sources) and will send you results via email (or if you’re more technically inclined, an RSS feed). The alerts will include links to sites that have written or somehow reference something about your app or your app’s features, depending on what keywords you are monitoring.
The monitoring options are very customizable, allowing you to receive an alert immediately, once a day, or once a week. You can also specify the number of results you want in an email. The challenge with Google Alerts, which you also face to some extent with Twitter, is to make the keywords you monitor provide relevant results. Since the Web is considerably more expansive than Twitter alone, the likelihood of spam and irrelevant alerts is higher with Google Alerts. Beyond tweaking your keywords, as with Twitter, try using some of Google’s search operators to make your alerts more effective (http://www.google.com/help/cheatsheet.html).
- Customer reviews
Your customer reviews on the App Store can represent some of the richest feedback you’ll receive about your app. It’s typical for them to trend on the negative side—especially for $0.99 or free apps—because there is a low barrier to download them and price-sensitive customers will not read your application description. If you are mostly receiving one- or two-star ratings and poor reviews, though, it is a clear indication that there’s a problem with your app.
If there are outliers, and the majority of your reviews are positive, don’t lose your cool. In fact, you’ll want to be aggressive about engaging the most negative critics of your application.
Email is another of your most direct means to receive feedback. Unlike with customer reviews on the App Store, emails from customers require a response from you. Timely support responses are a key component of keeping your customers happy and engaged with your app. I will cover that aspect in more depth in the next section, but note that it should not prohibit you from answering any questions that may arise in the interim.
It’s possible that you have some other channels to receive qualitative customer feedback. For example, if you are in a larger organization, you may offer phone support. You may have also implemented a support tool mentioned in Chapter 5. In general, however, these are some of the key channels to monitor feedback about your app.
The quantitative side of feedback is numbers-based. You’ll be able to use information from Apple and your analytics provider to give you a broader, more data-driven perspective on how your app is doing.
- Sales and trends
iTunes Connect is where you’ll find all of the Apple-provided data about your app. The first place you can visit is the Sales and Trends area, which is available from the iTunes Connect home page. By clicking that link, you can preview or download the daily or weekly reports for your app, which shows information related to what app was downloaded, the number of downloads (Units), the royalty price (i.e., your portion of revenue from sales), and the currency and country code associated with the download or purchase. A Monthly Free report will also consolidate all free downloads into a monthly report that corresponds with financial periods.
Note that the daily and weekly reports represent trends and should not be considered the financial accounting for the royalties Apple will pay you for your paid app(s). You can find that information in the Financial Reports (discussed momentarily). The reports in this area are purged regularly by Apple, with the daily reports being removed after seven days and the weekly reports after 13 weeks. So, you’ll want to download and archive these reports somewhat regularly.
I’m going to bias you pretty heavily when it comes to the Apple-provided data. You will save yourself some serious headaches and frustration if you use a third-party tool to help interpret this data. The main reason is that these “reports” are really not reports at all, but instead are more like raw data. If you are very handy with spreadsheets, you can manipulate this data in something such as Microsoft Excel or Apple’s Numbers to make better sense of it.
Very intuitive tools are available, however, that provide actual sales reporting and simplify the iTunes Connect data download process. And depending on what analytics platform you implemented in your app, you may be able to see both your sales and your analytics data in one location. The analytics providers can often also collect other diagnostic information such as crash reports, or even help check for piracy (again, depending on how you integrated them). I’ll highlight the options I recommend in the following list, identifying the key differences among them.
Note
Most cases of piracy occur in regions where an actual app sale would have never occurred in the first place. As a result, many developers don’t bother with piracy checks. If you do pursue them, your options include tools such as mtiks (http://www.mtiks.com/), plug-ins from analytics providers, or your own custom solutions.
- AppViz (http://www.ideaswarm.com/products/appviz/)
AppViz is a paid Mac OS X application (offering a 30-day free trial) that was developed by Ideaswarm and will download your iTunes Connect application data and subsequently visualize it for you. Unlike what you receive in iTunes Connect, in AppViz you’ll be able to see data grouped by an app across all regions (which is particularly useful if you have several apps). AppViz can optionally pull in your iTunes reviews and ranking information, giving you a single dashboard to assess key feedback about your app.
- appFigures (http://www.appfigures.com)
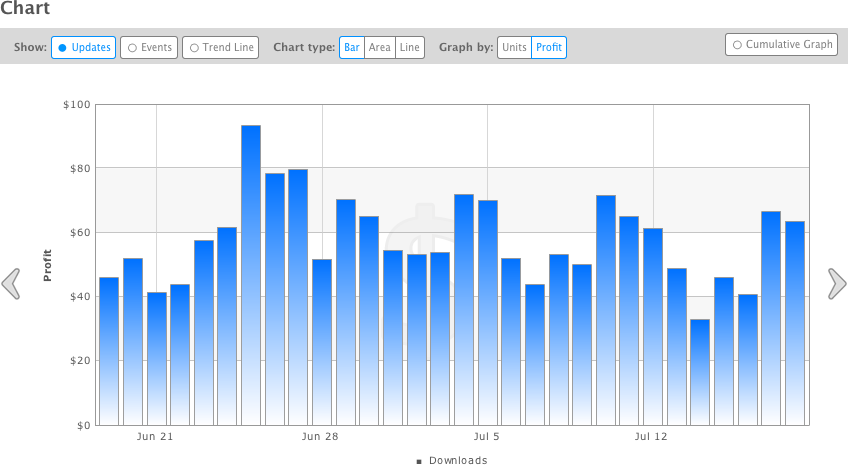
Compared to AppViz, the distinctions for appFigures (see Figure 9-2) are that it is web-based, offers automatic daily syncing with iTunes Connect, and thus can deliver daily email reports of how your app is doing. Since you are going to be busy with your app, the latter two features are particularly useful. With appFigures, you won’t have to worry about your reports being purged by Apple before you obtain a copy of them, since they will be downloaded each day for you. Ariel Michael, the co-founder of appFigures, is interviewed at the end of this chapter.
- Heartbeat (http://www.heartbeatapp.com/)
Like appFigures, Heartbeat is web-based. One of the key differences is that depending on whether you choose to integrate Heartbeat into your app as your analytics provider, you can view both sales and analytics information in the Heartbeat dashboard.
- TapMetrics’ TapMini (http://tapmetrics.com/tapmini)
TapMetrics is another analytics provider (and, like Heartbeat, is also mentioned in Chapter 7) that can give you a more comprehensive sales plus analytics display of your app’s performance. The TapMini tool (Mac OS X download) will automate your iTunes Connect download data and sync those reports with TapMetrics daily.
- Analytics
Data about downloads and sales only gives you a bird’s-eye perspective about the fact that customers are downloading your app. What it doesn’t help you understand is how many customers are actually using your app over time and what specifically they are doing in it. As you know from Chapter 7, that’s the reason analytics exist.
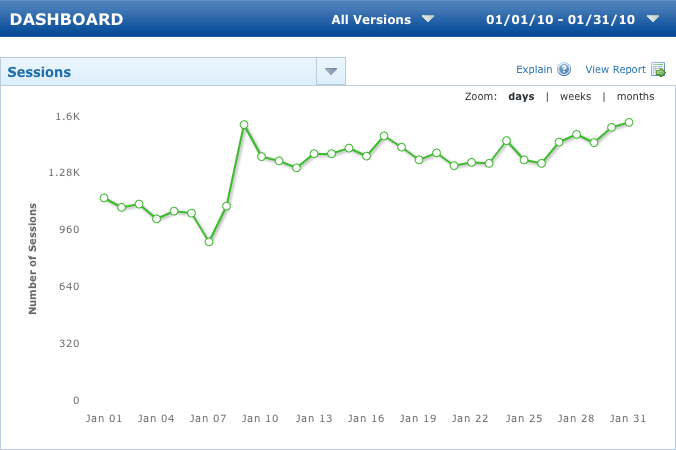
In general, the analytics you’ll want to pay attention to include the number of sessions for your app (where “session” represents one application open by a customer), sessions per month (also called “frequency of use” by platforms such as Flurry), average session length, number of active users, and number of new users (versus those who might have redownloaded your app). See Figure 9-3.
You may also be tracking a number of events in your app. Because the actions that are important for an app can vary widely, events are extremely important. So, if you didn’t initially add any events to track in your app (e.g., identifying when a customer uses a particular feature or completes a certain task), you should consider adding one or more to give you additional insight. Peter Farago, VP of marketing at Flurry, discusses what you should be learning from analytics and events at the end of this chapter.
- Crash logs
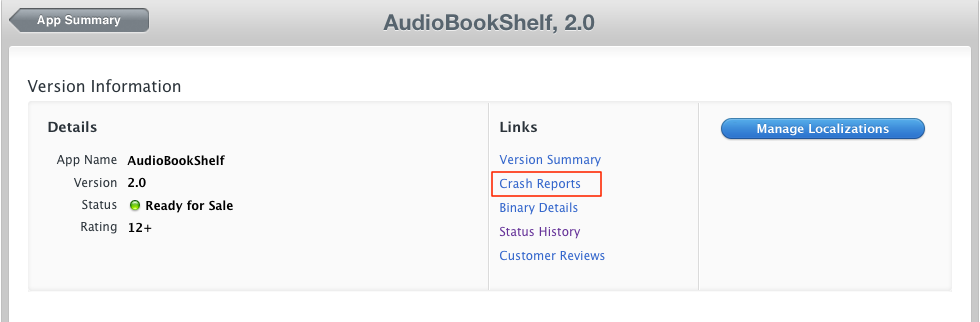
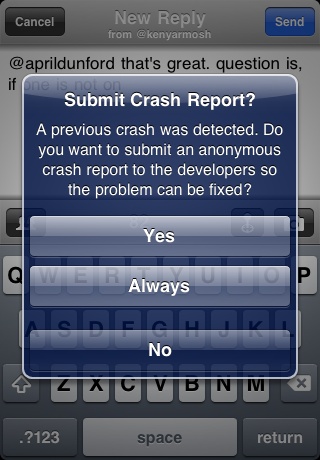
Crash logs were mentioned in Chapter 6, as part of beta testing. At this point in your app’s existence, they serve as the most technical quantitative feedback you can receive. You can use the same methods described in that chapter to have your customers send you any crash logs generated by your app (see Figure 9-4); hopefully there are few, if any. Once your app is in the App Store, though, Apple provides a way to view the logs that were submitted by your customers through iTunes, which occurs in the background when they sync their devices (unless they previously opted out of this function). You can view these logs in iTunes Connect within the Version Information screen for a particular application by clicking Crash Reports.
A much more aggressive (and fairly uncommon) way to deal with crash logs is to intercept the events causing the application to crash when they occur, and then prompting a customer to send the reports directly to you when the app is reopened. To explore integrating this type of option, take a look at Plausible CrashReporter (http://code.google.com/p/plcrashreporter/) and MacDevCrashReporter (http://macdevcrashreports.com/). See Figure 9-5 for an example of the latter.
- Financial reports
The third-party sales tools mentioned earlier can help you understand the actual payments you should receive from your paid apps. Because Apple has some unique accounting principles that affect when you can receive payments, it’s worth detailing them for you.
To start, select the Financial Reports link from the iTunes Connect home page. When you first visit this area, you will likely not see any reports. Apple only provides financial reports once a month, based on its fiscal calendar. When they’re available, you’ll find seven reports representing the United States (and Latin America), Canada, Europe, United Kingdom, Japan, Australia (and New Zealand), and “Rest of World.” Apple will only provide you a payment when your app sales in any given region are greater than $150. In such cases, you will also see a Payment Advise file for that region, indicating the payment that was made. When the $150 threshold is not met, Apple will withhold payment, rolling it over until the sales are greater than $150 for that particular region in a given fiscal month.
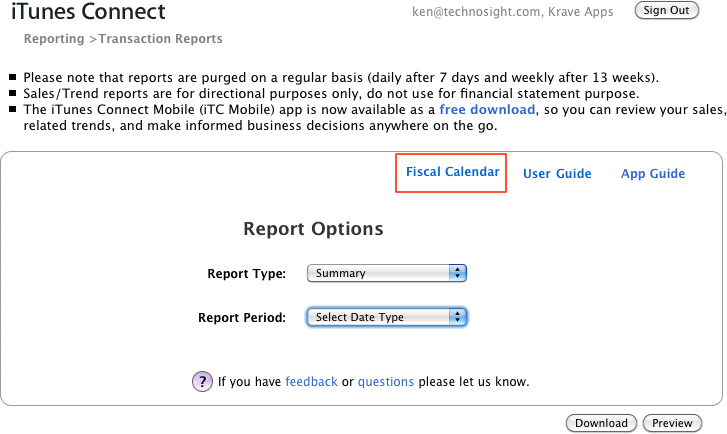
You should also note that payments are typically made three to four weeks after the close of a fiscal month. So, depending on when your app is purchased, it’s possible you might not receive your first check for at least two months. Apple’s most current fiscal calendar is available from the Sales and Trends area of iTunes Connect via the Fiscal Calendar link (see Figure 9-6).
Get App Savvy now with the O’Reilly learning platform.
O’Reilly members experience books, live events, courses curated by job role, and more from O’Reilly and nearly 200 top publishers.

