Statistical Quality Control

Chapter Outline
15-1 Quality Improvement and Statistics
15-1.1 Statistical Quality Control
15-1.2 Statistical Process Control
15-2 Introduction to Control Charts
15-2.2 Design of a Control Chart
15-2.4 Analysis of Patterns on Control Charts
15-3 ![]() and R or S Control Charts
and R or S Control Charts
15-4 Control Charts for Individual Measurements
15-6.1 P Chart (Control Chart for Proportions)
15-6.2 U Chart (Control Chart for Defects per Unit)
15-7 Control Chart Performance
15-8.1 Cumulative Sum Control Chart
15-8.2 Exponentially Weighted Moving-Average Control Chart
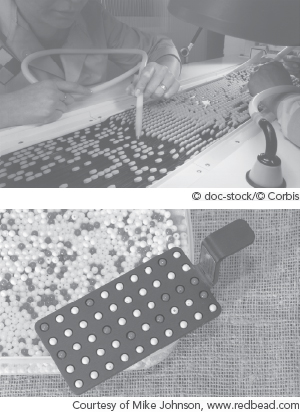
Bowl of beads
The quality guru W. Edwards Deming conducted a simple experiment in his seminars with a bowl of beads. Many were colored white but a percentage of red beads was randomly mixed in the bowl. A participant from the seminar was provided a paddle made with indentations so that 50 beads at a time could be scooped from the bowl. The participant was allowed ...
Get Applied Statistics and Probability for Engineers, 6th Edition now with the O’Reilly learning platform.
O’Reilly members experience books, live events, courses curated by job role, and more from O’Reilly and nearly 200 top publishers.

