10.3. Pinpointing the Cause of an Exception
Problem
You want to identify problems only when an exception occurs.
Solution
Dynamically turn on page-level tracing from within
the Catch block of your
exception handler and write to the trace log.
In the code-behind class for the page, use the .NET language of your choice to:
Set
Page.Trace.IsEnabled = truein theCatchblock of your exception handler.Write to the trace log by using a
Trace.Writeof the formTrace.Write("Exception","Message“,exc).
Figure 10-3 shows the appearance of some exception
information in the trace sequence. Example 10-4 through Example 10-6 show the
.aspx file and VB and C# code-behind files for
the application that produces this result.
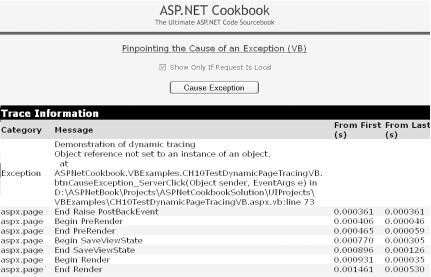
Figure 10-3. Exception information in the trace sequence
Discussion
ASP.NET processes and displays trace statements only when tracing is enabled. However, what if you don’t want to see the trace log all the time, but only when an exception occurs? The answer is to turn tracing on dynamically for the page. You can then write the exception information to the trace log and debug the problem from there.
Our example that illustrates this solution is rather primitive, in that it simply forces an exception. While this is not something you would normally do in production code, it does allow us to show the infrastructure needed to control tracing at runtime.
When the exception occurs, the
Get ASP.NET Cookbook now with the O’Reilly learning platform.
O’Reilly members experience books, live events, courses curated by job role, and more from O’Reilly and nearly 200 top publishers.

