Use Perl to dynamically fetch data from the Web, and then use R to create scatter plots.
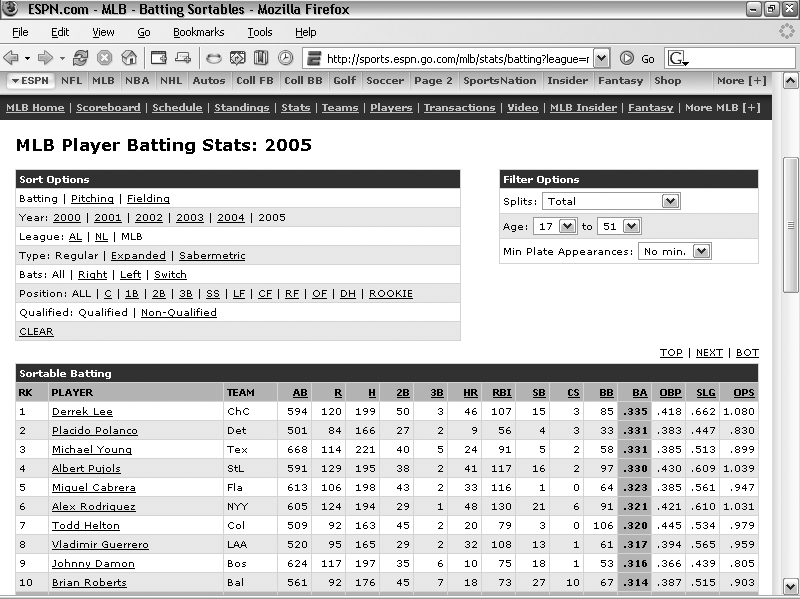
ESPN’s stats page has lots of good data about team performance. As you can see in Figure 4-18, the data is comprehensive and useful, but it appears in long, boring tables. This hack shows how to use Perl to extract this data, directly from the Web and from R, to create nice charts and graphs.
You access the data using a URL that looks like this: http://sports.espn.go.com/mlb/teams/batting?team=TeamID. TeamID is a three-letter abbreviation. For example, if you’re looking for data on the Red Sox, replace TeamID with BOS; if you’re looking for data on the Tigers, replace TeamID with DET; and so on. (If you’re in doubt about a team’s ID, go to the ESPN web site, select the stats for the team you want, and then read the URL.)
This hack is comprised of two parts: one part extracts the data from the ESPN site, and the other creates the display. This first script queries http://www.espn.com for the TeamID value you pass it and then writes a pipe (|) delimited text file that you can easily import into R. Save the following listing into a file called get_data.pl:
	#!/usr/bin/perl

	# PERL MODULES TO USE
	use LWP::Simple;
	use HTML::TableExtract;

	# WHAT TEAM TO PULL?
	$TeamID = $ARGV[0];

	# CREATE FILE TO PLACE OUTPUT INTO
	$outfile = 'data.txt';
	open OUT,">$outfile" or die "can't open file $outfile for output!\n";

	# GRAB HTML OF ESPN WEBPAGE FOR GIVEN TEAM
	$URL  = "http://sports.espn.go.com/mlb/teams/batting?team=" . $TeamID;
	$html = get($URL);

	# PARSE HTML INTO NEW TABLEEXTRACT OBJECT
	$te = new HTML::TableExtract();
	$te->parse($html);

	# WE'RE INTERESTED IN THE 5TH HTML TABLE IN THE PAGE
	$ts = $te->table_state(0,5);
	@rows = $ts->rows;

	# HOW MANY HTML TABLE ROWS?
	$N = scalar(@rows);

	# NOTE: WE'RE ONLY INTERESTED IN ROWS 3 TO N-4. HTML TABLE ROWS 1-2 CONTAIN
	# MENU ITEMS AMD ROWS N-4 TO N CONTAIN TOTALS AND OTHER FORMATTING.
	# ROW 3 IS HEADER ROW
	print OUT "TEAM|" . join("|", @{$rows[3]}) . "\n";

	# FOR REST OF ROWS, PIPE-DELIMIT DATA PLUS A LINEFEED
	for $i (4 .. $N-4) {
	  print OUT "$TeamID|";
	  print OUT join("|", @{$rows[$i]});
	  print OUT "\n";
	}

	# CLOSE OUTPUT FILE
	close OUT;
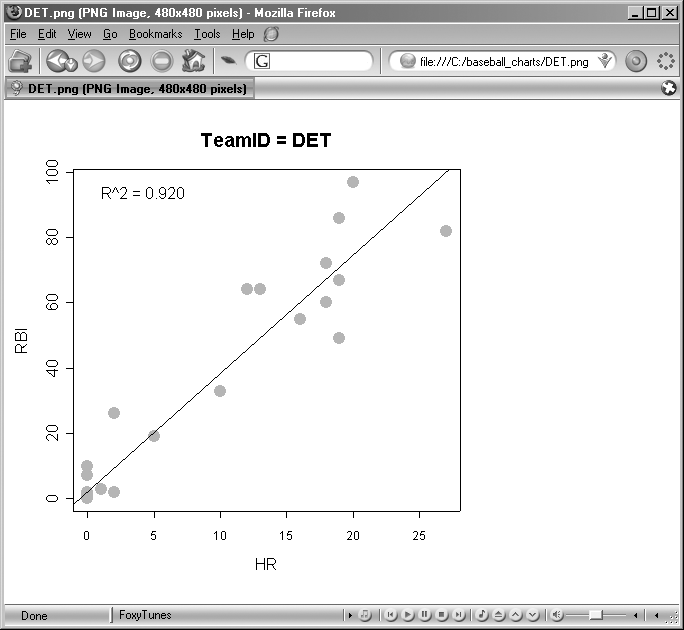
The next script is an R program that will import the pipe-delimited text file created using the Perl script, create a scatter plot of RBI versus HR, superimpose the R2 value, and save the file under the name TeamID .png. Type the following listing into a file called make_charts.r:
	# TELL R WHAT FOLDER AND FILE TO WORK WITH
	setwd("C:/baseball_charts")
	INFILE <- "data.txt"

	# FETCH DATA DOWNLOADED FROM WEBPAGE
	bbdata <- read.table(INFILE, header=TRUE, sep="|")
	TeamID = as.character(bbdata$TEAM[1])

	# TELL R TO OUTPUT THE PLOT TO FOLLOW A .PNG FILE
	OUTFILE = paste(TeamID,".png", sep="")
	png(filename=OUTFILE, bg="white")

	# BG PROPERTY ABOVE DOESN'T WORK IN R 2.0.0 - BUG?
	par(bg = "white")

	# CREATE SCATTER PLOT
	title = paste("TeamID =",TeamID)
	plot(RBI~HR, data=bbdata, pch=19, cex=2, col="orange", main=title)

	# APPEND LEAST SQUARES LINE
	abline(lm(RBI~HR, data=bbdata))

	# COMPUTE R^2 AND PLACE IT ONTO PLOT
	r <- cor(cbind(bbdata$RBI, bbdata$HR))[2,1]
	r2 <- formatC(r^2, format="f", digits=3)
	mtext(paste("R^2 =",r2), line=-2, at=1, adj=0)

	# CLOSE AND SAVE PNG FILE
dev.off()To run this hack, you will need Perl and the HTML::TableExtract module. For instructions on getting and installing Perl and Perl modules, see “Get Perl” [Hack #12] . To download the batting statistics for the Detroit Tigers from http://sports.espn.go.com/mlb/teams/batting?team=DET, parse the data, and create a delimited text file, you would call the Perl script as follows:
C:\baseball_charts>perl get_data.pl DET
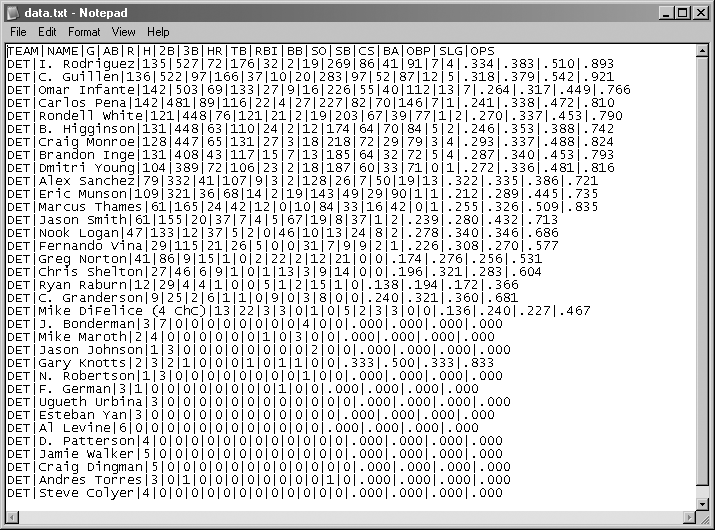
This will produce a file called data.txt, as shown in Figure 4-19.
Once you’ve got the data, it’s easy to import this file into R and create a scatter plot that saves as a .png image file. Instead of typing the commands into R one by one (because we already have them saved in the make_charts.r file, right?), we’ll just import the commands into R by using R’s source() function.
So in the R GUI, type the following (obviously, you’ll need to update your path):
>source("C:/baseball_charts/make_charts.r")If all went well, we should have DET.png sitting in the C:\baseball_charts folder. Simply use your favorite graphics editor or web browser to view it (see Figure 4-20).
It’s beyond the scope of this hack to explain how to set up a web server. But let’s say you have access to a web server that supports Perl, or you have a web server installed on your local computer (such as IIS or the free Apache Web Server). You can skip creating a physical text file and just update the R script to import the data from the Perl script by supplying a URL rather than data.txt!
For example, let’s say you rename get_data.pl to get_data.cgi, update it slightly to look like the following, and save it in a folder called CGI-BIN in your local web server:
	#!/usr/bin/perl
	# PERL LIBRARIES TO USE
	use CGI;
	use LWP::Simple;
	use HTML::TableExtract;

	# WHAT TEAM TO PULL?
	$browser = new CGI;
	$TeamID = $browser->param('team');

	# TELL BROWSER TO EXPECT PLAIN TEXT
	print "content-type: text/plain\n\n";

	# GRAB HTML OF ESPN WEBPAGE FOR GIVEN TEAM
	$URL  = "http://sports.espn.go.com/mlb/teams/batting?team=" . $TeamID;
	$html = get($URL);

	# PARSE HTML INTO NEW TABLEEXTRACT OBJECT
	$te = new HTML::TableExtract();
	$te->parse($html);

	# WE'RE INTERESTED IN THE 5TH HTML TABLE IN THE PAGE
	$ts = $te->table_state(0,5);
	@rows = $ts->rows;

	# HOW MANY HTML TABLE ROWS?
	$N = scalar(@rows);

	# NOTE: WE'RE ONLY INTERESTED IN ROWS 3 TO N-4. HTML TABLE ROWS 1-2
	CONTAIN
	# MENU ITEMS AMD ROWS N-4 TO N CONTAIN TOTALS AND OTHER FORMATTING.
	# ROW 3 IS HEADER ROW
	print "TEAM|" . join("|", @{$rows[3]}) . "\n";

	# FOR REST OF ROWS, PIPE-DELIMIT DATA PLUS A LINEFEED
	for $i (4 .. $N-4) {
	  print "$TeamID|";
	  print join("|", @{$rows[$i]});
	  print "\n";
	}

	# CLOSE OUTPUT FILE
	close OUT;
Then you can call this script by pointing your browser to http://localhost/CGI-BIN/get_data.cgi?team=DET to see the data dynamically fetched, parsed, and delimited. Of course, you can supply a team= value if you want (e.g., ATL, CIN, etc.).
Now, the really cool part is in the R script. Simply change the following:
INFILE <- "data.txt"
so that it reads:
INFILE <- "http://localhost/CGI-BIN/get_data.cgi?team=DET"
The scatter plot will be created for DET. Enter team=CIN, and a scatter plot file will be created for CIN because R’s read.table() function accepts not only a filename but also any URL that will return a valid file that can be read. Sweet!
You can actually run the R script in batch mode and not even have to open the R GUI at all. This allows you to create several plots en masse sequentially—say, for each team. On Windows, this is easy. Open Notepad, enter the following command, and save it as make_charts.bat:
	"C:\Perl\bin\perl.exe" get_data.pl ATL
	"C:\Program Files\R\rw2000\bin\RTerm.exe" --vanilla --quiet <make_charts.r

	"C:\Perl\bin\perl.exe" get_data.pl BAL
	"C:\Program Files\R\rw2000\bin\RTerm.exe" --vanilla --quiet <make_charts.r

	"C:\Perl\bin\perl.exe" get_data.pl BOS
	"C:\Program Files\R\rw2000\bin\RTerm.exe" --vanilla --quiet <make_charts.r

	"C:\Perl\bin\perl.exe" get_data.pl CLE
	"C:\Program Files\R\rw2000\bin\RTerm.exe" --vanilla --quiet <make_charts.r

	"C:\Perl\bin\perl.exe" get_data.pl MIN
	"C:\Program Files\R\rw2000\bin\RTerm.exe" --vanilla --quiet <make_charts.r

	"C:\Perl\bin\perl.exe" get_data.pl TEX
	"C:\Program Files\R\rw2000\bin\RTerm.exe" --vanilla --quiet <make_charts.r
Double-click the make_charts.bat file. When you’re done, you should see six .png image files for the six teams mentioned in the code.
Those really ambitious among you will realize that you can automate this even more by doing one of the following:
Update the Perl script to download separate text files for all teams, and then update the R script to search the folder containing the text files and loop through each found .txt file, importing each.
Take the web-server approach and just update the R script to use the URL approach and loop through all teams you’ve defined in some sort of array.
Either approach requires that you turn the meat of the R script into a function so that it can be called easily and repeatedly.
Get Baseball Hacks now with the O’Reilly learning platform.
O’Reilly members experience books, live events, courses curated by job role, and more from O’Reilly and nearly 200 top publishers.


