9.8 Generalized linear models
9.8.1 Logistic regression
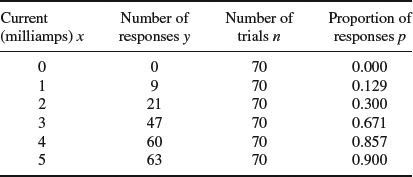
We shall illustrate this technique by considering some data from an experiment carried out by R. Norrell quoted by Weisberg (1985, Section 12.2). The matter of interest in this experiment was the effect of small electrical currents on farm animals, with the eventual goal of understanding the effects of high-voltage powerlines on livestock. The experiment was carried out with seven cows, and six shock intensities, 0, 1, 2, 3, 4 and 5 milliamps (shocks on the order of 15 milliamps are painful for many humans; see Dalziel et al. (1941). Each cow was given 30 shocks, five at each intensity, in random order. The entire experiment was then repeated, so each cow received a total of 60 shocks. For each shock the response, mouth movement, was either present or absent. The data as quoted give the total number of responses, out of 70 trials, at each shock level. We ignore cow differences and differences between blocks (experiments).

Our intention is to fit a smooth curve like the one shown in Figure 9.12 through these points in the same way that a straight line is fitted in ordinary regression. The procedure here has to be different because proportions, which estimate probabilities, have to lie between 0 and 1.
Figure 9.12 Logistic curve .
We define
and then observe that a suitable family of curves is given by
or equivalently