The Influence of Inflation
Before proceeding with the analysis, though, we pause to consider inflation. The data was collected over a relatively short period of time (almost six years), but we wonder if we should adjust for inflation to ensure that the prices paid in 2003 are comparable to the prices paid in 2008. A commonly used reference for calculating inflation is the consumer price index (CPI) produced by the Bureau of Labor Statistics at http://www.bls.gov/CPI. The CPI calculates the price of a weighted "basket" of frequently purchased consumer goods and services. This price is calculated monthly, and we will use the west coast series, series CUUR0400SA0, to adjust for inflation as follows. We want to adjust all values to 2003 dollars, so we divide each CPI value by its value in March 2003. This operation is also known as indexing. It gives the relative worth of a 2003 dollar at each point in time and makes it easy to read the effect of inflation from the graph: a value of 1.1 represents a cumulative inflation of 10% from the start of the data. Figure 18-2 shows the CPI-based inflation measurement and the effect of adjusting prices for inflation. Inflation has been steadily climbing over the last five years, and we can see that the inflation-adjusted rise in house prices is slightly less pronounced than the unadjusted trend.
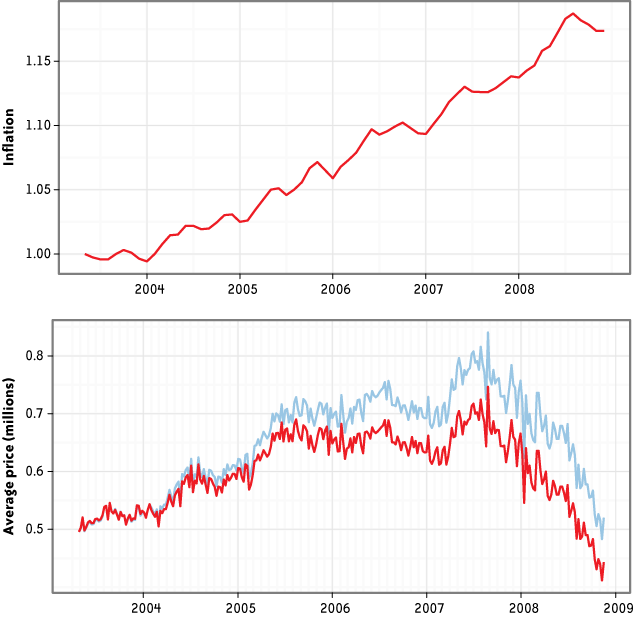
Figure 18-2. (Top) Inflation, indexed at 1 at start ...
Get Beautiful Data now with the O’Reilly learning platform.
O’Reilly members experience books, live events, courses curated by job role, and more from O’Reilly and nearly 200 top publishers.

