Chapter 2. Understanding Behavioral Data
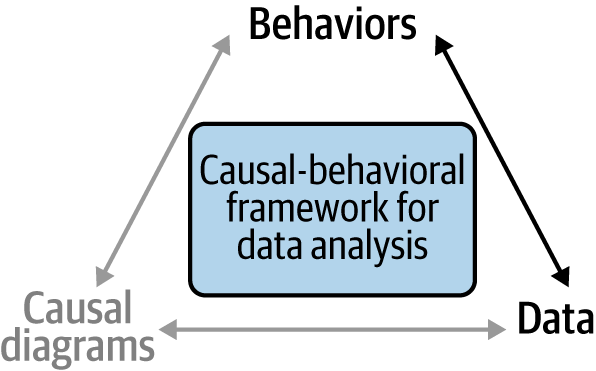
In Chapter 1 we discussed that the core goal of this book is to use data analysis in order to understand what drives behavior. This requires understanding the relationship between data and behaviors, which was represented in Chapter 1 by an arrow in the causal-behavioral framework (Figure 2-1).

Figure 2-1. The causal-behavioral framework with the arrow for this chapter highlighted
Forgive the pop-culture reference, but if you’ve seen The Matrix, you’ll recall that the main character can look at the world around him and see the numbers behind it. Well, in this chapter you’ll learn to look at your data and see the behaviors behind it.
The first section is mostly directed to readers with a business or data analysis background and offers a basic “behavioral science 101” introduction to core behavioral science concepts. If you’re a behavioral scientist by training, you probably won’t find much that’s new here, but you may want to skim through just to get a feel for the specific terms I use.
Based on that common understanding, the second section will show you how to look at your data through a behavioral lens and determine the behavioral concept related to each variable. In many cases, unfortunately, a variable is at first only loosely related to the corresponding behavior, so we’ll also learn how to “behavioralize” such wayward variables.
Get Behavioral Data Analysis with R and Python now with the O’Reilly learning platform.
O’Reilly members experience books, live events, courses curated by job role, and more from O’Reilly and nearly 200 top publishers.

