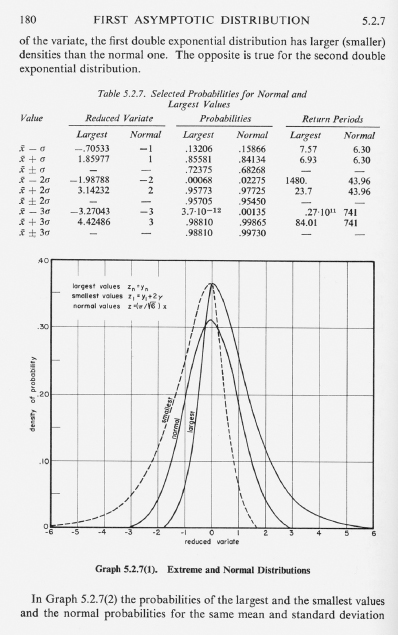
Chapter 4 describes the principal database search tool, BLAST. While BLAST was first described by Altschul et al. in 1990, the statistical interpretation of the scores you get in a BLAST search are based on mathematical models developed by the 1950s. In many instances, the distribution of values in a population assumes a normal (Gaussian) distribution, as shown in this figure (see curve labeled “normal”). However, for a wide variety of natural phenomena the distribution of extreme values is not normal. Such is the case for database searches in which you search with a protein or DNA sequence of interest (the query) against a large database, as will be described in this chapter. The maximum scores fit an extreme value distribution (EVD) rather than a normal distribution. In 1958 Emil Gumbel described the statistical basis of the EVD in his book Statistics of Extremes. This figure (Gumbel, 1958, p. 180) shows the EVD. Note that for the curve marked “largest” the tail is skewed to the right. Also, as shown in the table, for a normal distribution, values that are up to three standard deviations above the mean occupy 99.865% of the area under the curve, while for the EVD values up to three standard deviations occupy only 98.810%. In other words, the EVD is characterized by a larger area under the curve at the extreme right portion of the plot. We will see how this analysis is applied ...
Get Bioinformatics and Functional Genomics, Second Edition now with the O’Reilly learning platform.
O’Reilly members experience books, live events, courses curated by job role, and more from O’Reilly and nearly 200 top publishers.

