Appendix. The Early Warning System-Details
In Chapter 4, page 78, we mentioned that additional details and examples for steps 5–9 would be provided in this section.
Step 5: Entering Leading, Lagging, and Connectors into a Spreadsheet
The sample spreadsheet, Table A.1, shows where the leading (columns A-D), connector (E–G), and lagging indicators (columns H-J) and variances are entered. You can also clearly see in the spreadsheet how after each forecasted indicator and connector assumption, that “actual” results or numbers from a campaign are entered.
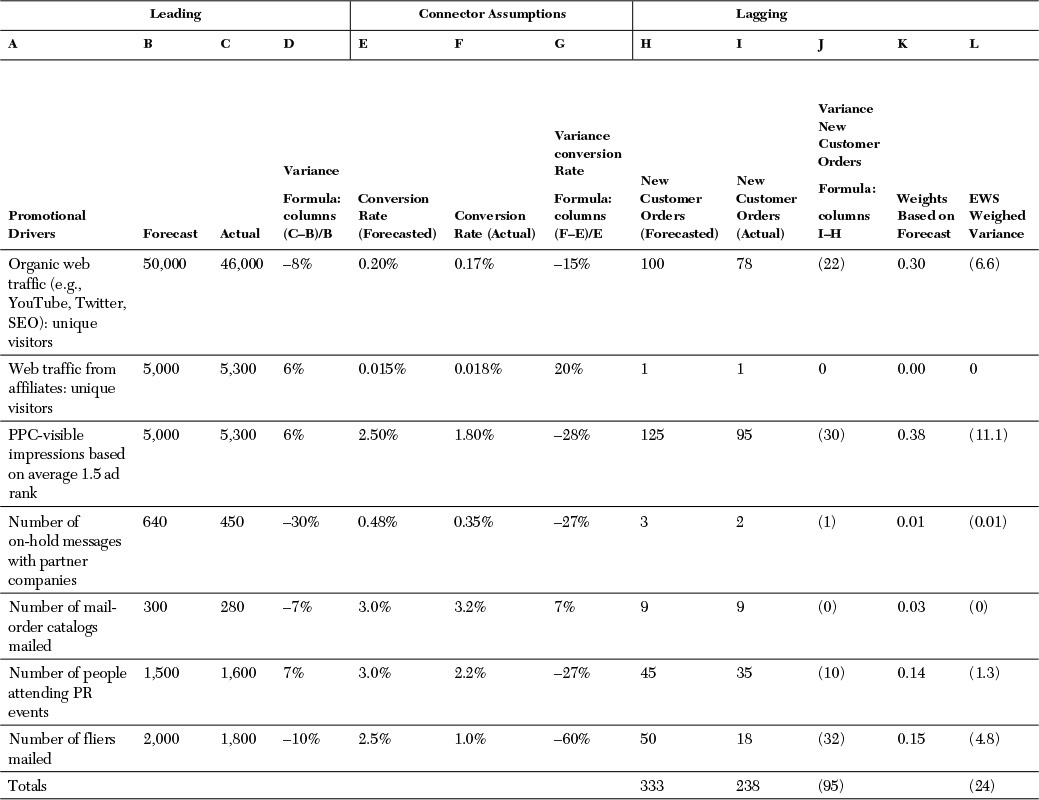
Table A.1 Example of a Causal Forecast
Table A.1 covers in detail steps 5–9 from Chapter 4 ...
Get Breaking Failure: How to Break the Cycle of Business Failure and Underperformance Using Root Cause, Failure Mode and Effects Analysis, and an Early Warning System now with the O’Reilly learning platform.
O’Reilly members experience books, live events, courses curated by job role, and more from O’Reilly and nearly 200 top publishers.

