Chapter 8. Debugging Your Game
Impact’s Debugger
As our game comes together and we begin to add more entities,
performance is going to become a concern. Also, there may be things we
need to see, such as the bounding boxes of entities and how many entities
are on the screen at any given time. Luckily for us, there is a really
great debugger built into Impact. In order to use it, we will need to add
the following class to the main.js
requires block:
'impact.debug.debug'
Once you have added this, refresh the game in your browser and you should now see the debug menu on the bottom of the screen (see Figure 8-1).
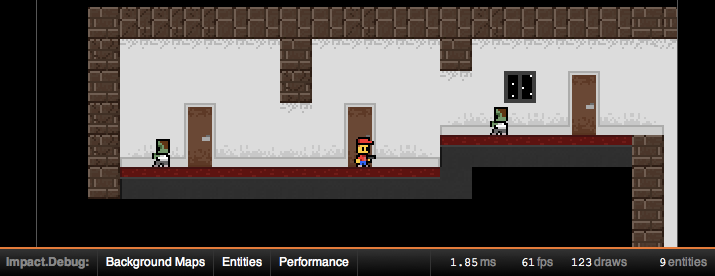
As you can see, the debugger has some very helpful features. On the right-hand side, you will see the number of milliseconds your code takes to execute on each frame, followed by the frames per second, draws, and finally the number of entities. On the left are options to explore the map layers, individual entities, and performance. Let’s take a deeper look, starting with the map layers shown in Figure 8-2.
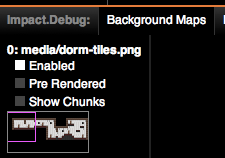
Here, you can see a preview of your entire map and what is currently being rendered in the ...
Get Building HTML5 Games with ImpactJS now with the O’Reilly learning platform.
O’Reilly members experience books, live events, courses curated by job role, and more from O’Reilly and nearly 200 top publishers.

