Chapter 7. Multiple Studies and Comparisons
In Chapter 6, we learned how the application of technical studies (also known as indicators) can provide new insights into a chart's price action, including providing explicit buy and sell signals. However, you may find there is value in applying more than just one study at a time.
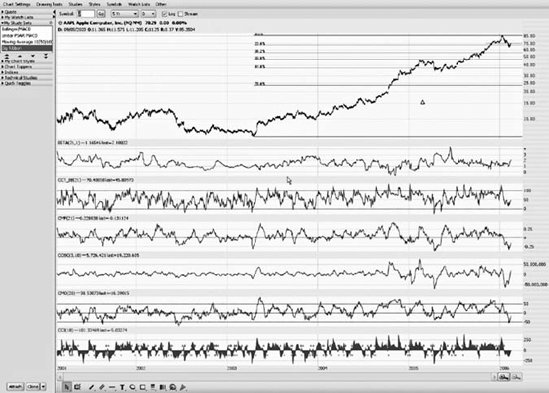
In ProphetCharts, the price graph and any overlay studies are in a single charting pane. The volume, if displayed, is in a separate pane and any other independent technical indicator each has its own pane (Figure 7.1). The value of having separate panes is that you can rearrange the order and size of each of those panes. Panes in ProphetCharts have a number of powerful properties:
They can be arranged in any order you like.
They can each be as tall or short as you like.
The volume pane can be suppressed or revealed at any time.
You can apply technical studies to virtually any pane.
That last point is particularly important. There is no reason, for instance, that a Simple Moving Average cannot be applied to the Volume pane as easily as it could be applied to the Price pane. The flexibility in ProphetCharts provides a virtually unlimited palette for crafting technical studies to help you make better trading decisions.

Figure 7.1. Many studies can be applied at once to assist in the analysis of a chart, and each study can be in its own individual pane.
THE TECHNICAL STUDIES ...
Get Chart Your Way to Profits: The Online Trader's Guide to Technical Analysis with ProphetCharts, Second Edition now with the O’Reilly learning platform.
O’Reilly members experience books, live events, courses curated by job role, and more from O’Reilly and nearly 200 top publishers.

