Let’s not be too sure that we haven’t been missing something important.
—Bill James, baseball statistician and author, from his article “Underestimating the Fog”
This is a book about coders, software development teams, metrics and patterns. The ideas in this book originated a few years ago when I started to think about the makeup of software teams, both good and bad, and all the subtle contributions and unsung heroes that are a critical part of success. For almost two decades now, I’ve been responsible for building and managing teams of designers, coders, and testers. Over this time I’ve realized that software teams, similar to sports teams, require a variety of players and skills to succeed. I’ve also learned that there are patterns to success and failure that are not necessarily what I assumed before.
Here’s a simple pattern I’ve seen, and maybe you’ve seen it too: every successful software team I’ve been on has always had at least one person who uncomplainingly does the little things, like creating the installer, improving the build scripts, or fixing other people’s bugs to get features done. The projects never would have been done, or at least not done well, if someone hadn’t taken on these smaller but detail-oriented tasks.
Another pattern: many seasoned software teams I’ve seen had one or two coders who were the clear technical leaders, the go-to people, although they may not necessarily have had the titles to match. These go-to coders not only solved problems, but they exerted a strong influence on others, such that the skills of the other coders often evolved rapidly, closer to the level of the technical leaders. As a result, one or two great coders raised the level of the entire team.
Here’s a pattern I’ve observed on some of the longer projects I’ve been a part of, especially with small teams in start-up environments: the project team hit a “wall” when the project was about 80% complete. Like a marathon runner at the 20-mile mark, after months of pushing hard, everyone is suffering from real mental and physical fatigue. Sometimes when the teams hit the wall, we broke down and never really recovered. The final 20% of the project seemed to go on forever, and we basically limped to the finish line. But sometimes the team went through the wall, recovered, and picked up the pace again. In every case, this recovery happened because someone on the team had the personality to lighten the load, tell jokes, lift spirits, and make everyone feel better. Thanks to the “joker” on the team, everyone got back to a (mostly) positive mindset, ready to sprint to the finish.
Patterns of success seem obvious once we see them, but to see them we must learn where and how to look. Once I started to think about this, I began to wonder whether we could create a set of metrics that would give us a clear and objective way to identify, analyze, and discuss the successes or failures of our software teams and the full range of coder skills and contributions. Not as a way to rate performance, but as a way to help us better understand and foster the keys to success, and where and how we might improve. In my own teams I began to experiment, and the positive results have me very encouraged that these methods could be useful for others, too.
This book is my attempt to share some of these ideas and practices. To this point, there is very little material written or otherwise available regarding metrics that can be used to analyze coders and software teams. We have thoughtful books on interviewing, skills-testing, project estimation, project management, team management—and on Agile and other methodologies that make the development process more effective. But we have never had much discussion or explored a quantitative and analytical approach to understanding the skills and work of individual coders to improve software teams.
Our metrics, to the extent that most software teams use them today, are commonly a simple set of counts that we use in project estimation or in ongoing project management. We use bug counts, task counts, time increments (hours/days/weeks)—and with Agile, some of us use story points and velocity. There are also more advanced systems and tools for project estimation that make use of sizing metrics such as KLOCs and Function Points.
But the metrics we commonly deal with don’t provide enough insight to answer many key questions that we have, such as:
How well is our software team succeeding?
How are individual team members contributing to the team’s success?
What capabilities can be improved to achieve greater success?
These are simple but profound questions. If we can’t answer these questions, or lack a clear way to discuss and think about the answers, then as individuals and team members, we are not doing all we can to succeed. Of course, we must fundamentally explore what we mean by success and how we measure success for software teams, but assuming this can be sufficiently settled, then the above questions remain. In the pages that follow, I will try to suggest new and different ways for us to achieve greater understanding and perhaps answers, too.
I’m a big sports fan, and so in many parts of this book, I’ve chosen to use sports analogies. It’s not necessary, however, for you to like or understand sports to understand the concepts in this book. Like all analogies, the purpose is just to help make the ideas quicker to grasp and easier to remember. Personally, I think using sports analogies to discuss software teams is apt—and fun.
I think of software development as a team sport. Software products are typically not produced by an individual but by a team, and even in the case where one coder works alone, that coder must fill the various roles of a larger team. In sports, we know that successful teams require players that complement each other, and not everyone needs nor should have the same skills. A football team needs players who can block and tackle as well as those that can run, pass, and catch. Not everyone is good at the same thing. In fact, a team where all players have the same strengths, no matter how strong, is in many cases worse than a team where players have different and contrasting skills. In the end, every player on the team matters, and every player must do their part if the team is going to succeed.
My first thoughts about applying quantitative analysis to coders came from the attention that statistical analysis has recently garnered in major organized sports. Computers and software have contributed to enormous changes in how professional sports teams analyze player statistics, and how they determine the player skills that most directly contribute to winning teams. Bill James and other noted analysts have created a discipline around statistical analysis of baseball players referred to as “sabermetrics”. And author Michael Lewis has popularized these newer approaches to sports team management in his books Moneyball and The Blind Side, and in his articles in The New York Times Magazine and other publications.
Many of the people who have pioneered these new approaches in sports management have training in more analytical fields, such as Daryl Morey (GM of the NBA Houston Rockets) who majored in computer science at Northwestern, and Paul DePodesta (VP of the MLB New York Mets and former GM of the Los Angeles Dodgers) who majored in economics at Harvard. This “new” approach in sports is often depicted as a reaction to and move away from the more subjective, gut-feel approach of talent evaluation and team-building. Major sports teams are now very big businesses, with huge amounts of money involved. In this new era, managers responsible for these teams spend more time gathering and analyzing metrics, to help them build winning teams in a more rational and predictable way (and as Moneyball illustrates, in a way that can be more cost-effective and profitable, too). This doesn’t eliminate individual intuition and creativity, but augments it with better knowledge. The key steps followed in this new approach are:
Find a way to measure the differences between winning and losing teams.
Find a way to measure the contributions of individual players to their teams.
Determine key player characteristics that are highly correlated with winning or losing.
The process of finding meaningful metrics and formulas in sports is not static, but continuously evolving. It’s well understood that there are many important but subtle skills that are hard to measure and analyze, such as a defensive football player’s instinct to find the ball carrier or a player’s ability to perform under pressure. Bill James, for example, publishes regular articles and annual books on baseball in which he introduces new metrics and ideas, some of which others adopt and use, some of which others improve, and some of which turn out to be less useful and eventually fade away.
And metrics evolve privately as well as publicly. The actual statistics and formulas that sports teams favor are secretly guarded, since sports is, of course, a competitive field. Many analysts who write publicly also work as private consultants for individual teams. Theo Epstein (GM of the MLB Boston Red Sox) and Billy Beane (GM of the MLB Oakland A’s) may share some information with each other, and they may both benefit by the metrics known to the wider community as a whole—but in the end they are trying to win against each other, so there are some elements about their approach that will never be known outside their organizations.
Our field of software development is less public, with different competitive pressures than major sports leagues, and most coders are not in the public eye. We don’t and probably never will have fans poring over our statistics or putting our poster on their wall (now there’s a scary thought). But it seems a little ironic that those of us who work in a field that in many ways enabled deeper statistical analysis in sports (as well as in other industries), have not yet embraced or fully considered the potential benefits of quantitative analysis in our own domain of software development.
Naturally we, like any workers, might be suspicious about whether good metrics can be found and tell an effective story, and we might be worried that statistics can be misused by managers in performance reviews and such. It is the premise of this book, however, that within our discipline there are a variety of skills and results that we can indeed measure, and from which we can obtain meaningful and useful insights about ourselves and our teams. These numbers are not black and white, and individual numbers never tell the whole story. Knowing Derek Jeter’s batting average or Tim Duncan’s shooting percentage tells you only a very small part of how effective they are as players and teammates. But when we look at a range of statistics, we can begin to identify patterns for individuals and teams, and sometimes what we find is surprising, even revelatory.
As an example, let me tell you about one of the software teams I managed for many years.
Note
A note about the stories in this book: these come from my own experience. However in many cases, the stories have been simplified or generalized to convey the key points. I will not use names in order to protect the innocent and the guilty alike, including me.
This example was at a venture-backed start-up, with a team of six coders and three testers (we are focusing on coders in this book, so I will focus on them in this example). There were three key phases that we went through in the first two years: initial development of our 1.0 product release, which took nine months; the period after release when we supported the first customers and developed our 1.1, which took six months; and the development of our 2.0 product release, which took another nine months. The team itself had three senior coders, each with more than ten years of experience and excellent domain knowledge, and three junior coders each with excellent educational backgrounds and about two years of commercial coding experience. During this two year period, all the senior coders remained, but two of the junior coders left after the first year and we brought on two more.
Our executives and our investors thought our initial 1.0 release was a great success. We won a major award at a key industry show and received multiple positive product reviews. We had a large amount of reseller interest, and the number of customer evaluations were double our expectations, so our sales staff was incredibly busy (this was an on-premise enterprise software solution). Revenues in the first quarters after release were also well ahead of plan.
There were plenty of reasons for our software team to feel good, and everyone was patting us on the back. But was our 1.0 release really a success?
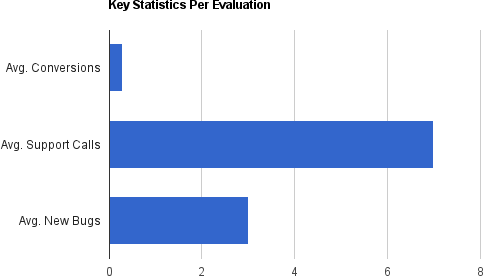
It took us a while to realize it, but a deeper look at the numbers at the time would have revealed some serious problems. The key and troubling facts were this: while we had succeeded in generating public awareness and solid customer interest, every customer trial was generating, on average, seven calls to customer support—despite the fact that each customer received installation and setup assistance. These seven calls were resulting in an average support time of three full days to work with the customer and investigate issues, and on average it turned out that every customer was identifying three new bugs in the product that had not been previously found. Coder time to support every customer trial, including the time to assist support and the time to fix significant product issues, was measured in weeks, not hours or even days.
And the seemingly positive revenue results were also misleading. We were ahead of our early revenue plans thanks to a few bigger deals, but our overall rate of converting evaluators to real customers and the time it was taking for conversion were much worse than we required to build a successful business. This was at least in part due to the usability and quality issues that were reflected in the support load and bugs found.
In other words, while outsiders might have thought that our initial release was very successful, in reality it was only a partial success at best. The data shown in Figure 1-1 reveals how bugs and support issues were vastly outweighing new users.
There was another big issue, too. As time went on, certain coders on the team were having trouble getting along. The decreased amount of time spent working on more “exciting” new features, and the increased time spent on less glamorous investigation and bug fixing, combined with the stress related to support in a start-up environment, began to reveal cracks in individuals and in our software team. Personality differences were exacerbated, to the point that certain coders were avoiding each other, and we even had a few incidents of people yelling in the workplace.
The six months following the 1.0 release, during which the team provided support and worked on the 1.1 release, were filled with turmoil and were a near disaster, even though those outside the team still thought everything was fine. Most of each coder’s time went into bug fixing, and we had to delay most of our incremental product improvements. The 1.1 release fixed all the critical bugs—but there were still so many issues remaining that even after the release, the support load and conversion rates did not materially change.
Then, suddenly, everything got much better inside the software team. Even though the support rate remained constant, the team started handling issues much more efficiently, with less people involved on every issue. More time was freed up for new features and major improvements in the most problematic areas. The 1.1 release, which had almost no feature improvements, took six months. The 2.0 release, which had multiple new features and major product improvements, took only nine months with the same size team. Following the 2.0 release, the conversion rate and issue rate noticeably improved, to the point that we could clearly say that the 2.0 release was a much greater success.
So what happened? Was it that everyone got used to handling the issues, or that the issues became repetitive or less severe? To a certain extent that was true. But the key change was that two junior coders left the team, and two other junior coders joined. The two coders who left did so of their own accord. While they had been mostly happy during the work on our 1.0 release, they were the ones who disliked the post-release support work the most. They were the ones who most regularly wanted or needed others, specifically the senior coders, to help them if they weren’t familiar with a problem or an area of code. And one of them was the one who had a temper and fought increasingly with other team members over time.
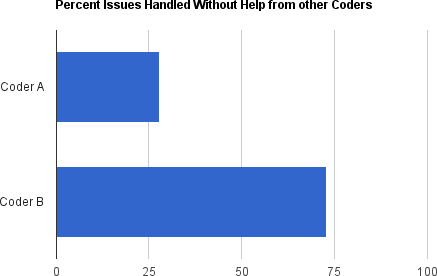
The new coders who joined the team were not measurably different from those who left in terms of education, experience, or aptitude. Where they were different, however, were in two key skill areas that became highly critical and useful following our first product release: the desire and willingness to solve problems independently and the ability to handle somewhat stressful situations calmly, even happily. Figure 1-2 shows how one replacement outperformed their predecessor.
Because the new coders possessed the right skills, they were able to take on and finish more problems themselves. It wasn’t necessarily that we were putting less time into support or fixing specific issues, but we were able to get less people involved and have less interruptions, so that other team members were able to stay focused on other work. In the end, we got lucky. Since we had some personality conflicts with the two coders who left, we consciously favored and selected job candidates who had very different personalities. But we didn’t realize the full benefits this would bring to our overall productivity and team success.
At the time all this occurred, we did not pay close attention to our metrics. Looking back, I realize how focusing the team on key metrics could have helped us react more quickly and effectively after the first product release. It’s hard to make everyone believe there are problems or understand the magnitude when they are being congratulated by outsiders for all the good things they’ve done. It is easy for a team to develop a false sense of complacency—or in the reverse case, to develop poor morale when they don’t get the praise they feel they deserve. Looking at a full range of product and team metrics can balance the adulation or criticism you receive, and provide much-needed perspective around where you’re really at and what needs to be done. Measuring and discussing skills such as self-reliance and thoroughness can help foster those skills, and help ensure that coders with those skills receive the credit and recognition they deserve for their contributions to the team.
The objective of this book is to present a method and a set of metrics—that is, codermetrics—that cover a variety of areas related to individual coders and software development teams. This method is designed to challenge our assumptions, in hopes that we can better discover what is knowable about the patterns that lead to success. To make them easier to understand and remember, the metrics in this book are named after analogous sports statistics. These metrics are designed to give us some terminology to better communicate, and hopefully to make us think generally about how these types of metrics can be useful in our field. In the end, their value can be measured by how well they help us answer the key questions that we face as to what it means to “win” and how we can better ourselves and our teams.
It is my hope that the concepts in this book will lead to further productive dialog between coders, team leaders, and managers, both within and across organizations. There is no doubt that many individual metrics introduced here can and will be improved; and that some of the ideas here will be dismissed, and even better metrics will be found. Personally, I have seen great value within teams in working to define a wider variety of items to measure, in figuring out how to measure and relate individual and team activities to organization goals, and then in sharing the data and discussing it among the team. Even for those of you who never actively use metrics, I hope that you can find value here and that some of the ideas in this book will positively affect how you think about coders and software development teams. If others begin to consider these concepts and perhaps use some of the approaches outlined in this book, working towards a broader and deeper rational analysis of coder contributions and software team-building, then I will feel this book is a success.
It should be noted, in case it’s not obvious, that there are many participants and skills in the software development process that are outside the scope of this book. This is partially because the full scope of participants and skills is too much to cover in a single book, and mostly because I personally have not defined a set of metrics for other skills. Perhaps in the future we will develop metrics for designers, testers, managers, or others—and maybe there will be writing on these, too.
Get Codermetrics now with the O’Reilly learning platform.
O’Reilly members experience books, live events, courses curated by job role, and more from O’Reilly and nearly 200 top publishers.

