Skip to Content
Cool Infographics: Effective Communication with Data Visualization and Design
book

Cool Infographics: Effective Communication with Data Visualization and Design

by Randy Krum
October 2013
Beginner
368 pages
7h 12m
English
Wiley
Content preview from Cool Infographics: Effective Communication with Data Visualization and Design

image

Vision trumps all other senses. We learn and remember best through pictures, not through written or spoken words.

—JOHN MEDINA, BRAIN RULES

image

The Science of Infographics

Why do people love infographics?

Humans have been drawing pictures to communicate with each other for thousands of years—from pictograms on cave walls to Egyptian hieroglyphics to ideograms on modern signs (Figure 1-1). People love using pictures to communicate and tell stories because it's hardwired into the human brain.

Infographics and data visualizations are all around us. We are surrounded by visual representations of information—charts, maps, icons, progress bars, signs, posters, diagrams, and online visuals (Figure 1-2). These are all examples of visual communication, but these are not all infographics.

image

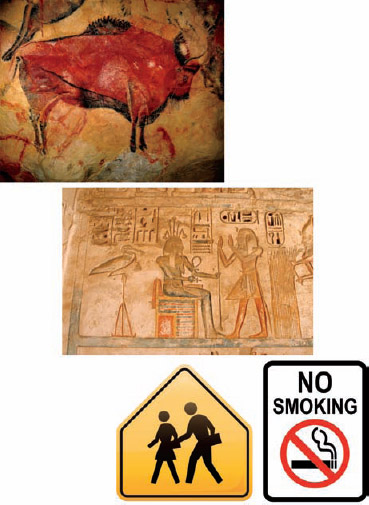
FIGURE 1-1 Altamira bison cave painting, ancient Egyptian hieroglyphics, and modern signs.

The word infographic is used by people to mean many different things. In many cases infographics and data visualizations are considered synonymous, but in the world of an infographic designer they mean different things.

Data visualizations are the visual representations of numerical values. Charts and graphs are data visualizations ...

Become an O’Reilly member and get unlimited access to this title plus top books and audiobooks from O’Reilly and nearly 200 top publishers, thousands of courses curated by job role, 150+ live events each month,
and much more.

Read now

Unlock full access

More than 5,000 organizations count on O’Reilly

AirBnbBlueOriginElectronic ArtsHomeDepotNasdaqRakutenTata Consultancy Services

QuotationMarkO’Reilly covers everything we've got, with content to help us build a world-class technology community, upgrade the capabilities and competencies of our teams, and improve overall team performance as well as their engagement.
Julian F.
Head of Cybersecurity
QuotationMarkI wanted to learn C and C++, but it didn't click for me until I picked up an O'Reilly book. When I went on the O’Reilly platform, I was astonished to find all the books there, plus live events and sandboxes so you could play around with the technology.
Addison B.
Field Engineer
QuotationMarkI’ve been on the O’Reilly platform for more than eight years. I use a couple of learning platforms, but I'm on O'Reilly more than anybody else. When you're there, you start learning. I'm never disappointed.
Amir M.
Data Platform Tech Lead
QuotationMarkI'm always learning. So when I got on to O'Reilly, I was like a kid in a candy store. There are playlists. There are answers. There's on-demand training. It's worth its weight in gold, in terms of what it allows me to do.
Mark W.
Embedded Software Engineer

You might also like

The Big Picture: How to Use Data Visualization to Make Better Decisions—Faster

The Big Picture: How to Use Data Visualization to Make Better Decisions—Faster

Steve Wexler
Beautiful Visualization

Beautiful Visualization

Julie Steele, Noah Iliinsky

Publisher Resources

ISBN: 9781118582305Purchase book