APPENDIX C
Statistical Tables
The appendix includes statistical tables that are commonly used in testing hypotheses and building confidence intervals. In order of appearance, the tables are:
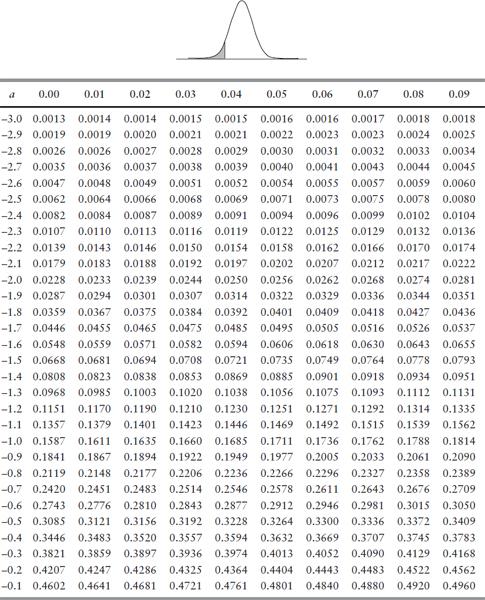
| TABLE C.1A: | Area under standard normal distribution from minus infinity to a for values of a< 0. |
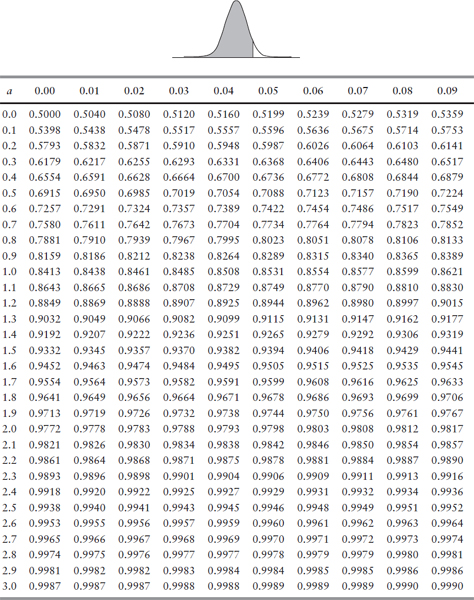
| TABLE C.1B: | Area under standard normal distribution from minus infinity to a for values of a > 0. |
| TABLE C.2: | Critical values of the chi-square (χ2) distribution for given levels of probability that the χ2 will exceed table entry. |
| TABLE C.3: | Critical values of the t-distribution for given levels of probability that the t-value will exceed table entry. |
| TABLE C.4A: | Critical values of the F-distribution for 5% probability level (α =.05) that the F-statistic will exceed table entry. |
| TABLE C.4B: | Critical values of the F-distribution for 1% probability level (α =.01) that the F-statistic will exceed table entry. |
| TABLE C.5: | 5% significance points of dl and du for Durbin-Watson test statistic. |
TABLE C.1A Area under standard normal distribution from minus infinity to a for values of a< 0.

TABLE C.1B Area under standard normal distribution from minus infinity to a for values of a> 0.

TABLE C.2 Critical values of the chi-square (χ2) distribution for given levels of probability that the χ2 will ...
Get Derivatives: Markets, Valuation, and Risk Management now with the O’Reilly learning platform.
O’Reilly members experience books, live events, courses curated by job role, and more from O’Reilly and nearly 200 top publishers.

